
Table of Contents
Key Messages
- The Revised Architecture of EU Climate and Energy Policies
With the Fit for 55 package, the European Union (EU) has adopted a comprehensive set of measures to achieve its 2030 energy and climate targets. These measures include the technology-neutral expansion of the emissions trading schemes (EU ETS and ETS 2) and accompanying technology-specific approaches, such as tighter vehicle efficiency standards and building regulations.
This policy-mix can reduce the risk of very high carbon prices if accompanying policies work in the same direction as the ETS, if sufficient financial resources for investments are available, and if they have the necessary political acceptance (such as for emission standards for cars) - Enhance Consistency and Reduce Fragmentation
EU climate policy has evolved historically, resulting in overlaps and gaps leading to inefficiencies and distortions. Case in point is the coexistence of ETS 2 and the Effort Sharing Regulation (ESR) that entails the risk of increased tension in the architecture, market distortions, and ultimately policy failure. Gradual convergence between the two systems, such as through flexible trading, could yield efficiency gains of up to 22% and help stabilize the ETS 2 carbon price. - Make Emissions Trading Fit for the Endgame
The EU ETS and ETS 2 must provide a stable and credible long-term price signal to offer companies reliable investment conditions. The Market Stability Reserve (MSR) is the central stability mechanism in both ETSs, intended to address shocks and uncertainties. Uncertain market reactions,, however, may exacerbate anticipated scarcity. This risk can be decreased by introducing dynamic thresholds for in- and outtake and using more refined indicators to calibrate the hedging corridor. - Develop an EU-Wide Hydrogen Market and Integrate It into the Energy Market
Hydrogen is essential for sectors where electrification is not feasible economically, technologically, or politically. Yet, the EU still lacks a comprehensive strategy for using low-carbon hydrogen as a transitional solution. Stronger integration of the hydrogen market and including upstream methane emissions in the ETS could accelerate the transition to low-carbon energy, but the possible distributional impacts of the integrated market need to be addressed. - Acknowledge the Spatial Dimension of EU Energy Policy
The revision of the Renewable Energy Directive (RED III) introduced a framework for spatial planning and permitting of energy projects. The introduction of “acceleration areas” and “multifunctional land zones” aims to optimize land use and reduce conflicts. To effectively implement this approach, Member States should pursue holistic land-use policies prioritizing multifunctional land-use planning. - Secure Financing for Climate Neutrality
Achieving climate neutrality requires high up-front investments that existing EU funding instruments cannot fully cover. Declining revenues from energy taxation and rising needs for social compensation and competitiveness measures further widen the financing gap. Centralizing green industrial investment at the EU level could generate efficiency gains but will require reliable and sustainable financing sources, such as own resources or joint borrowing.
1. Introduction
Authors: Benjamin Görlach (Ecologic), Michael Pahle (PIK), Ronja Busch, Jana Nysten (Stiftung Umweltenergierecht)
With the Fit for 55-package, the EU increased the ambition level of its energy and climate targets for 2030. By then, it aims to reduce GHG emissions by at least 55 % below 1990 levels, achieve at least a 42.5 % share of renewable energy in final energy consumption, improve energy efficiency by 11.7 % and reach a level of electricity interconnection of 15 %. The targets reflect the EU’s commitment towards an energy system transformation – or, in fact, the transformation of the entire EU economy towards climate neutrality. To achieve those targets and get that transformation going, the EU amended its legislative framework in key aspects: the targets have become more ambitious, geared at the medium- and long-term developments. It has also become more comprehensive, for instance by extending emissions trading to more sectors and emitters, and it has become more diversified, including new approaches to mitigate distributional effects or to safeguard the competitiveness of EU businesses and industries.
Following the adoption of the main legislative acts of the Fit for 55-package, the EU Member States are required to implement the new European rules, while the Commission will monitor the implementation and the functioning of the new framework. At the same time, the Commission will still have to clarify certain rules by delegating and implementing acts. Overall, the coming years will show whether the new framework is effective or whether additional changes are needed, such as to increase EU climate policy consistency and ensure target achievement. At its core, EU climate policy is path-dependent insofar as it continues to operate in a historically evolved structure, reflecting past political choices and legal and/or institutional constraints, rather than following a central principle.
At the same time, however, the EU is already in the midst of discussing a new (set of) climate targets for 2040, and has begun the process of developing an EU industrial policy that manages to combine industrial competitiveness with de-fossilisation. As the EU has committed to become climate neutral by 2050, and achieve net negative emissions thereafter, the establishment of an appropriate framework for 2040 will be crucial.
Several elements now come into view that will shape the EU’s post-2030 climate and energy architecture: What should be the overall architecture for EU climate policy as we enter a period of rapidly declining emissions (and ETS caps) – what complimentary policies are needed to ensure the functioning of the carbon price, enhance its effect, and mitigate possible related side-effects? Which policy overlaps and redundancies can be justified, and which need to be resolved for the policy mix to function efficiently? (How long) should the EU maintain two separate ETS, and at what time should they be converging towards a unified system? What is the role for hydrogen in the energy system and the EU energy market, which market rules and which infrastructure is needed?
These and other issues need to be addressed in an economic, financial and (geo)political environment that has become more difficult or even hostile, challenging the EU itself and its institutions, but also its role in the world. In this situation, a key issue is how to finance the transformation towards a truly sustainable energy supply – and economy – in the future, as well as how to distribute its costs. The starting situation is far from rosy: the EU’s economic outlook is grim, amid continued high energy costs and rising protectionist tendencies in many regions of the world. The latest introduction of tariffs by the US have been an escalation in this regard, directly harming European exported goods. This means that fewer resources are available to pay for investments in the transformation to climate neutrality, both public and private. Other spending needs compete for public resources: in particular security spending, but also, increasingly, climate change impacts and the need to adapt to them. Since the transformation itself creates winners and losers, assisting vulnerable groups and regions in the transition is paramount to securing acceptance. And finally, many of the necessary investments in the new, clean energy solutions are front-loaded and capital-intensive: while they will eventually be cheaper than the fossil system currently in place, they initially require massive investment into generation assets, appliances and infrastructure. Meanwhile, the rise of right-wing populist parties in the European Parliament have been detrimental to ambitious energy- and climate policies.
While the situation may be grim, it also underlines the fundamental importance of making the right choices, and designing policies to function in the most efficient way – especially in times of tight budgets. This underlines the case for removing frictions and overlaps, leveraging market forces where possible, including the potential of the EU single market, and working towards integrated EU-wide approaches rather than a patchwork of poorly coordinated national solutions.
Against this background, this report examines different facets of the EU energy and climate architecture for 2030 and 2040. It discusses potentials and weaknesses with regard to the EU’s transformation to climate neutrality. We thereby look both at some of the key policy instruments in place, and their potential overlap and interaction, as well as overarching challenges.
The results are presented in the form of brief summaries of the research behind them and are not intended to display an exhaustive discussion.
The contributions in this report are structured around two main research areas, each of which is presented in a separate chapter:
- First, the EU’s energy and climate architecture, the mechanisms for achieving the 2030 targets, a system analysis for the 2040 targets, the role of carbon markets and development prospects, among others.
- Secondly, the question of financing, including the role of public and private funding, distributional aspects and issues relating to the financing of industrial decarbonisation in the EU.
Each sub-chapter contains boxes with key messages.
2. Energy & Climate Architecture
2.1. Conceptual clarification: Scope and issues
Authors: Simon Feindt, Michael Pahle (PIK)
The first round of reforms to implement the Green Deal through 2030 begs the question of what has actually been achieved by it. Answering this question requires first of all to better understand the new architecture, its main compliance mechanisms and the interactions and coherence between them, as well as the distributional implications. So far, no comprehensive analysis of the new architecture taking into account final regulation has been conducted. What is more, understanding the new architecture is also important for going forward, i.e. to assess to which degree “simply extrapolating” it through 2040 could imply challenges that imply yet again more substantial reform for making it fit for the next decade. Here again, such analysis is still lacking. More broadly, getting clarity about the current architecture and where it might be headed is also helpful to assess if it is conducive to the emerging new political goals, namely competitiveness.
2.2 Analysis of the structure of the EU’s energy and climate 2030-framework, including inconsistencies and implementation
The European Union has committed to ambitious energy and climate targets for 2030 as part of its broader strategy to transition towards a sustainable and resilient economy. These targets, which include significant reductions in greenhouse gas (GHG) emissions, expansion of renewable energy, improvements in energy efficiency, and enhanced electricity grid interconnections, reflect the EU’s commitment to combating climate change and ensuring energy security.
This analysis provides a detailed examination of the legal structure and mechanisms underlying these targets, exploring how the EU’s legislative framework balances collective action at the Union level with Member State autonomy. By addressing the Fit for 55 package, the revised Renewable Energy Directive (RED III), and the integration of renewable and low-carbon hydrogen into the EU Emissions Trading System (EU ETS), the text highlights the opportunities and challenges inherent in achieving the 2030 goals.
Through these discussions, the analysis underscores the importance of cooperative governance, innovative regulatory approaches, and harmonized national policies in advancing the EU’s energy transformation and its decarbonization objectives.
2.2.1 Legal assessment of the structure of the energy and climate targets of the EU until 20301This input is based on the research for a comprehensive background paper “Energie- und Klimapolitische Vorgaben der EU bis 2030”, Würzburger Studie zum Umweltenergierecht, forthcoming 2025.
The negotiations on the Fit for 55-package, that updated the EU’s 2030 energy and climate targets and reformed the legislative framework to achieve these targets, have just been concluded. Meanwhile, the discussions on a 2040 climate target and the legal framework to achieve this have already commenced. To provide a solid basis for the development of the legislative framework for 2040, a profound understanding of the current architecture of the EU energy and climate targets until 2030 and the EU’s approaches to achieve them seems to be essential. The EU’s 2030 targets for energy and climate are defined in Art. 2 Nr. 11 Governance Regulation2Regulation (EU) 2018/1999 of the European Parliament and of the Council of 11 December 2018 on the Governance of the Energy Union and Climate Action (Governance Regulation).as binding targets for the EU and its Member States to reduce GHG emissions by at least 55 % compared to 1990 levels, increase the share of renewable energy in final consumption to at least 42,5 %, improve energy efficiency by at least 11,7 % compared to the projections of the 2020 EU Reference Scenario for 2030, and achieve at least 15 % interconnection of electricity grids between the Member States.3The interconnection target will not be analysed in detail as it is fundamentally different from the GHG, RES and Energy Efficiency targets.These four targets are legally binding for the EU and the Member States collectively, meaning it is not possible to sue any individual Member State for failure to achieve these EU targets.
1) The architecture of EU energy and climate targets until 2030
The origins of the EU energy and climate policies date back to the 1990s when on international level, the UNFCCC4United Nations Framework Convention on Climate Change, 1771 UNTS 107 (UNFCCC).codified the commitment to reduce greenhouse gas (GHG) emissions. From the very beginning, EU climate policies have always been discussed together with the promotion of renewable energy and the transformation of the EU’s energy system to a resilient, integrated and efficient system that fosters economic growth and reflects social considerations. The 2030-targets are thus part of that bigger transformation and serve multiple purposes (i. e. environmental protection, energy security, integration of the energy system). In the past, the GHG emissions reductions target has often been the “driver” for the other energy and climate targets.
Key message 2.1: The EU pursues a comprehensive energy and climate policy, which includes GHG emissions reductions, renewable energy, energy efficiency and electricity grid interconnection targets for 2030. They are to be understood as interim steps on the way to a holistic transformation of the EU economy to achieve climate neutrality the latest by 2050 and the energy system required for this.
2) The EU legal framework to achieve the 2030 targets
In order to achieve the 2030 energy and climate targets, the EU has set up a comprehensive legal framework with different approaches, taking into account the different competences under EU law.5Article 191 f., Article 194 TFEU.
The reduction of GHG emissions in the EU6Reduction of at least 55% compared to 1990 levels by 2030, Article 4(1) Regulation (EU) 2021/1119 of the European Parliament and of the Council of 30 June 2021 establishing the framework for achieving climate neutrality (EU Climate Law).is being pursued by a three-pronged approach that covers all GHG emissions (budget approach) and reduces them via legally binding reduction pathways. On the one hand, the EU established an EU-wide Cap-and-Trade system for the industry, energy, aviation and maritime sectors, the EU emissions trading system (EU ETS). The EU ETS is governed by the ETS-Directive7Directive 2003/87/EC of the European Parliament and of the Council of 13 October 2003 establishing a system for greenhouse gas emission allowance trading within the Union and amending Council Directive 96/61/EC.that leaves little discretion to the Member States when it comes to implementation. On the other hand, to reduce GHG emissions that do not fall within the scope of the EU ETS, the EU is pursuing a different approach with the Effort Sharing Regulation (ESR)8Regulation (EU) 2018/842 of the European Parliament and of the Council of 30 May 2018 on binding annual greenhouse gas emis-sion reductions by Member States from 2021 to 2030 contributing to climate action to meet commitments under the Paris Agree-ment and amending Regulation (EU) No 525/2013.and the LULUCF Regulation9Regulation (EU) 2018/841 of the European Parliament and of the Council of 30 May 2018 on the inclusion of greenhouse gas emissions and removals from land use, land use change and forestry in the 2030 energy and climate framework, and amending Regulation (EU) No 525/2013 and Decision No 529/2013/EU.Instead of introducing an EU-wide system like the EU ETS, legally binding national emissions reduction targets or sink targets are set and it is left to the Member States to develop national policies and measures to achieve these national targets. Alongside those main instruments, there are a number of other rules that Member States must comply with, implement and take into account. These rules mainly relate to emissions reductions in sectors covered by the ESR and include for example CO2 emissions performance standards for new cars and heavy-duty road vehicles or the establishment of a second emissions trading system for buildings and road transport (ETS 2). However, they do not take away the Member States’ primary obligation for the achievement of their national ESR targets. Rather, they are measures that the Member States must implement as part of their policy mix in order to achieve the required GHG emissions reductions in these effort sharing sectors.
In the field of renewable energy, the Renewable Energy Directive10Directive (EU) 2018/2001 of the European Parliament and of the Council of 11 December 2018 on the promotion of the use of energy from renewable sources.states an EU-wide binding target11Achieving a share of renewable energy in the Union’s gross final energy consumption of at least 42,5 % in 2030, Article 4(1) RED.but leaves it to the Member States to determine their national contributions and a corresponding trajectory for the achievement of this collective EU target12This constitutes a paradigm shift compared to the Renewable Energy Directive 2009/28/EC, under which the Member States had to achieve legally binding targets on national level. However, with regard to the 2030 framework, the Member States were no longer supportive of such an approach.Although the national contributions are indicative in nature, there is a mechanism to ensure an overall sufficient level of ambition, including through obligations for individual Member States to take additional measures, in case the EU falls short on reaching the reference points of its trajectory.13Article 32(3) Governance Regulation.In addition, EU law provides for additional rules that must be implemented and applied by the Member States and thus influence the national policy mix. Among others, Member States need to achieve sector-specific sub-targets for renewable energy in the heating and cooling, industry, mobility and buildings sectors14e.g. Articles 22a, 22b RED.or facilitate and speed up planning and permitting procedures for renewable energy projects, e.g. through the establishment of so-called renewables acceleration areas.15Articles 15, 15b-16f RED.
The approach for achieving the EU’s energy efficiency target set out in the Energy Efficiency Directive (EED)16Article 4(1) Directive (EU) 2023/1791 of the European Parliament and of the Council of 13 September 2023 on energy efficiency and amending Regulation (EU) 2023/955.is similar: Member States determine their own contribution towards the overall EU target alongside a trajectory. However, since the last revision in 2023, the EU Commission can overrule national contributions that are deemed insufficient. Moreover, the Member States are legally obliged to take additional measures in case they fall short on their trajectory.17Article 4(6) EED.Here too, the EU influences national policy-making through specific energy efficiency measures prescribed by EU law, e.g. through energy efficiency performance standards for non-residential buildings.18Article 9 Directive (EU) 2024/1275 of the European Parliament and of the Council of 24 April 2024 on the energy performance of buildings (EPBD).
To ensure sufficient ambition and progress in achieving all four EU targets, the Governance Regulation establishes a comprehensive framework for reporting, monitoring and – in some cases – course-correction Member States are obliged to draft19Articles 3 ff. Governance Regulation set out the obligation to submit integrated national energy and climate plans (NECP). Those plans need to be updated at least once during their 10-year-term according to Article 14 Governance Regulation. In addition, Article 15 Governance Regulation encourages the Member States to also develop Long Term Strategies, that cover a 30-year perspective.strategic National Energy and Climate Plans (NECPs) and to report on the progress of implementation.20Article 17 Governance-Regulation.Moreover, with regard to the ESR and LULUCF targets, the Member States are required to submit specific GHG inventory and projection reports.21See Article 26 and Article 18 Governance Regulation; those reports are also required by international law under the UNFCCC.However, to ensure sufficient progress towards these GHG targets, the corresponding EU regulations contain their own mechanisms that differ from those in the Governance Regulation and the EED, in particular in terms of the level of bindingness and the time horizon within which follow-up action must be taken. Here, the mechanisms for renewable energy and energy efficiency are more binding.
Key message 2.2: For each target, the EU pursues a different approach; none of them appears to be fundamentally inappropriate to achieve the targets. While the EU ETS and Effort Sharing are the main mechanisms for reducing GHG emissions, the achievement of the renewable energy and energy efficiency targets is primarily based on Member States’ self-determined national contributions to the overall EU target and by corresponding national policies and measures. However, there are several interactions between the different measures to achieve the 2030 targets.
The article, “Advocating Harder Soft Governance for the European Green Deal: Stakeholder Perspectives on the Revision of the EU Governance Regulation”22Bruch, Nils / Knodt, Michèle / Ringel, Marc (2024): Advocating harder soft governance for the European Green Deal. Stakeholder perspectives on the revision of the EU Governance Regulation, in: Energy Policy, Vol. 192, 114255, https://doi.org/10.1016/j.enpol.2024.114255., reveals broad support among stakeholders for stronger implementation and enforcement. However, “harder soft governance”23Knodt, Michèle / Ringel, Marc / Müller, Rainer (2020): ‘Harder’ soft governance in the European Energy Union, in: Journal of Environmental Policy & Planning, Vol. 22, Special Issue: Harder soft governance in European climate and energy policy: exploring a new trend in public policy, https://doi.org/10.1080/1523908X.2020.1781604. approaches – such as linking Member State compliance with Commission recommendations to access EU funding (cross-sectoral conditionality) – could further strengthen the EU’s energy and climate framework24Schlacke,Sabine / Pause, Fabian / Knodt, Michèle / Thierjung, Eva-Maria / Busch, Ronja (2024):Ariadne brief: Strengthening the EU Governance Regulation for the 2030 climate targets, https://ariadneprojekt.de/en/publication/brief-strengthening-eu-governance-regulation-climate-targets/. yet remain insufficiently addressed by both stakeholders and policymakers.
3) Potential and limitations of the EU legal framework for achieving the 2030 targets
Both the targets and the measures to achieve them interact with each other. For example, measures to support the expansion or use of renewable energy generally also serve decarbonisation purposes. Conversely, decarbonisation measures such as the ETS support the expansion of renewables by creating a financial incentive to switch to renewables. These interactions are taken into account in the Commission’s proposals, but not necessarily in the final legal acts adopted by the EU Parliament and Council.
It should also be noted that the achievement of the target is likely to depend mainly on good cooperation between the EU and the Member States as well as on the clarity and predictability of the legal framework. Legally binding targets in the area of energy and climate are not per se a guarantee that they will be met. On the contrary, it seems at least as important to have effective rules to ensure sufficient progress towards the 2030 target. As the division of competences in EU law is to some extent reflected in the division of responsibilities for achieving common EU targets, Member States will continue to play an essential role here. However, EU law gives the EU Commission the primary responsibility and task of ensuring the functioning of the target achievement mechanisms and for taking the necessary steps if gaps occur.
Key message 2.3: Whether a target is legally binding or not is not the only factor when considering the effectiveness of an approach to target achievement. Overall, the energy and climate policies strongly rely on the cooperation between the Union institutions and the Member States. The EU Commission can always propose revi-sions of the current legal framework but the adoption of those proposals is again subject to the approval of the majority of Member States.
2.2.2 Area-based prioritization of renewable energy projects through a new regulatory planning framework – Stepping towards minimizing land-use conflicts in Europe?
Authors: Sabine Schlacke, Christoph Plate, Eva-Maria Thierjung (IfEUS)
To achieve the ambitious energy and climate goals established by the European Union, alongside the imperative of ensuring energy security, a significant shift has been enacted by the European legislator. The amendment of the Renewable Energy Directive (RED) through Directive (EU) 2023/2413O25J L, 2023/2413, 31.10.2023., commonly known as RED III, has transitioned the Directive’s role from solely promoting renewable energy (RE) projects to a comprehensive framework concerning spatial planning and administrative permit-granting processes. This marks a pivotal development, as the Union legislator has, for the first time, established a permanent framework dedicated to the planning and approval of RE projects.
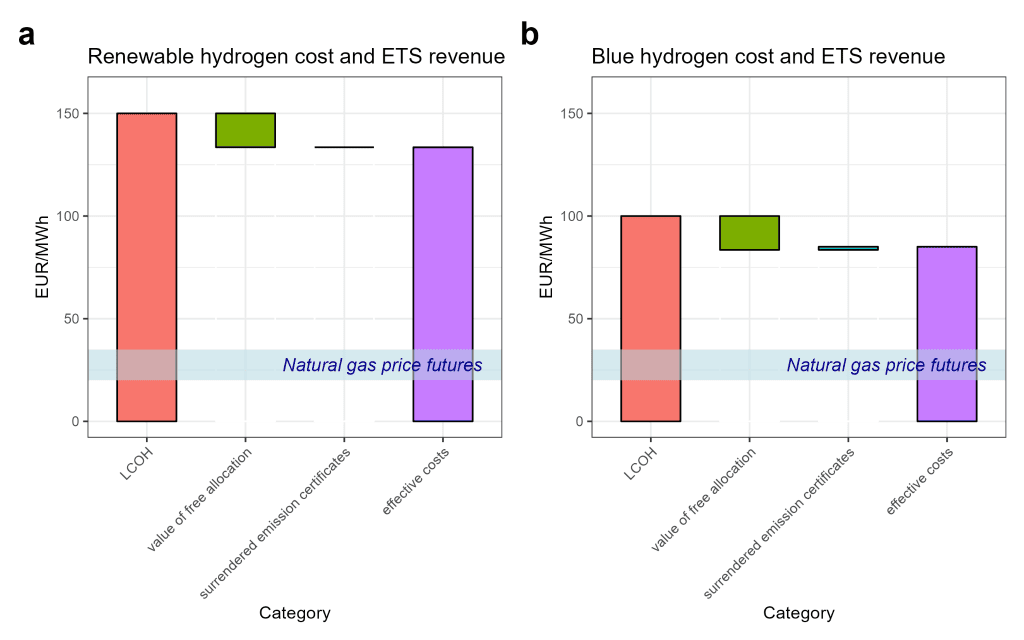
Additionally, the energy supply crisis that erupted following Russia’s unlawful invasion of Ukraine has created a critical political window for action, necessitating the implementation of related emergency measures (so in particular the Council Regulation (EU) 2022/257726OJ L 335/36, 29.12.2022.,27Schlacke/Thierjung, Im Dschungel der Beschleunigungsgesetzgebung zum Ausbau von erneuerbaren Energien: EU-Notfall-VO, § 6 WindBG und RED III und IV, Das Deutsche Verwaltungsblatt 2023, 635.).This paradigmatic change of the RED from a legBoth renewable and blue hydrogen production costs will likely be dramatically higher than those of natural gas (Figure 1). Natural gas is the main competitor in many important hydrogen applications, for example in the energy-intensive industry or energy supply sectors. In 2025-2030, renewable hydrogen costs are estimated to be about 6 times as high as those of natural gas. Low-carbon blue hydrogen will likely be about 4 times as expensive as natural gas.
These cost gaps are only slightly reduced by the value of freely allocated emission certificates (green part in Figure 1) for hydrogen production in the EU ETS. The current CO2 prices are simply too low to create much of a difference in the very high hydrogen costs. This underlines that both renewable as well as blue hydrogen scale-up requires additional policies (e.g., subsidies or regulation).al act aiming to “establish […] a common framework for the promotion of energy from renewable source” (Art. 1 sentence 1 RED III) to one also regulating Member State’s spatial planning and administrative permit-granting procedures is characterized by three distinct approaches, the most important one being the “typifying approach”. It requires Member States to designate acceleration areas for the establishment of RE projects and related grid and storage installations (cf. Art. 15b and Art. 15c RED III). Secondly, the EU legislator utilizes the instrument of overriding public interest in favour of RE installations (Art. 16f RED III) ensuring that these projects regularly prevail against competing interests and installations, particularly regarding land use conflicts. Thirdly, the role of financial compensation to offset significant environmental impacts is strengthened.28Thierjung, Erleichterungen des Ausbaus der Erneuerbaren Energien durch die EU-Notfall-Verordnung und weitere Änderungen im Umweltrecht, Das Deutsche Verwaltungsblatt 2024, 529.Furthermore, Member States now have the option to designate infrastructure areas necessary to integrate RE into the electricity system (cf. Art. 15e RED III). The purpose of these designations is to expedite the approval and realization of RE projects within these special areas, as environmental assessments at the permitting level are waived and the broader Strategic Environmental Assessment (SEA). By these means, although the Union lacks explicit competence for terrestrial planning, it is, for the first time, establishing concrete area designation requirements for Member States. These requirements, based on several competences, namely for legal harmonization, environment, and energy legislation, conflict with already extensive national regulations on land allocation and (further) intensify existing land-use conflicts.
Key message 2.4: The most recent amendment to the Renewable Energy Directive (RED), commonly referred to as Renewable Energy Directive III (RED III), has to be qualified as a paradigm shift evolving the named legal act from an instrument promoting renewable energy sources (RES) into a framework that encompasses planning and permit-granting procedures and not only of RE plants, but also relat-ed storage and infrastructure. Its central operating mechanism is the obligation to designate “acceleration areas” with the consequence of explicit land-use demands being articulated at the EU level for the first time resulting in a (further) increase of competition for available land.
Member States are currently required to transpose the RED III into national law. In Germany, these provisions intersect partially with an already extensive body of regulations, including statutory land designation obligations for RE installations29§§ 2 no. 1 lit. b, 3 para. 1 sentence 1 WindBG, 3 no. 4, 5 para. 1 no. 2 WindSeeG., performance-based target setting, prioritization30Müller/Schlacke, § 207 Organisationsrechtliche Fragen der Klimaverwaltung, Rn. 61, in: Kahl/Ludwigs (Hg.), Band VII: Aufgaben, Organisation und öffentliche Sachen, C.F. Müller (in press), privileges, and land protection clauses. Constantly growing multidimensional ‘spatial conflicts’ arise: The national legislator is confronted not only with physical land-use conflicts but also legal conflicts over land management. The German legislator had planned to address this challenge primarily through procedural and substantive synchronization of the designation processes of both regulatory levels as far as possible: Areas designated for wind energy deployment under national law should, corresponding to the drafts, also constitute designations required by Art. 15c para. 1 RED III31§§ 249a para. 1 sentence 1 BauGB-E, 28 para. 2 ROG-E, 5 para. 2b WindSeeG-E.;for solar energy this alignment was designed as a preferred option32§§ 249c para. 1 sentence 1 BauGB-E, 29 para. 2 1 ROG-E.and both designations should happen in one administrative step. For infrastructure projects in the sense of Art. 15e of the RED III, the draft foresaw the introduction of “infrastructure areas” as a new category in German energy planning law (§ 12j EnWG-E). Furthermore, these legislative proposals have refrained from formulating additional – at least quantitative – land-use demands. However, due to the premature dissolution of the government and parliament and the snap election that followed, these proposals were not adopted in the previous legislative period. Only time will tell to what extent the new federal government, which has not been formed yet, will be guided by the proposals of its predecessor.33In any case, due to the principle of discontinuity, the 2024 drafts have no binding effect whatsoever.
Key message 2.5: The German legislator had planned in 2024 to address the challenge posed by overlapping land designation obligations across different regulatory levels primarily through procedural and substantive synchronization of the designation processes of both regulatory levels, wherein areas designated under German law are deemed to simultaneously constitute areas designated under Art. 15c para. 1 of the RED III, thus also fulfilling the EU law obligations.
The idea – contained in the 2024 drafts of the previous government – of combining the area designation procedure under national law with designations for the realization of the obligations arising from RED III is to be welcomed. Though, this approach does not sufficiently address the issue of increasing overplanning of land34Cf. BT-Drs. 20/12785; BT. Drs. 20/11226, 20/12145; BR-Drs. 431/24.and the associated intensifying pressure on this finite resource. To effectively tackle this challenge, a more holistic approach to spatial planning is necessary which elevates the idea of multifunctional land-use, as set forth in Art. 15b para. 3 RED III, to a guiding concept of national planning law35WBGU, Flagship report. Rethinking Land in the Anthropocene: from Separation to Integration, 2020.For this to be realized, the German legislator must further elaborate and concretize this concept, which remains only vaguely defined at the EU level, by translating it into operable mechanisms. One possible and favourable measure would be to establish a new land designation category, so-called “multifunctional areas” within the Federal Spatial Planning Act (Raumordnungsgesetz, ROG)36Schlacke/Plate, Multifunktionale Flächennutzung: Potentiale und Grenzen des Raumordnungsrechts, Zeitschrift für Umweltrecht 2024, 323.Initial approaches in this direction can already be found in the aforementioned drafts regarding amendments to the ROG as well as the one concerning the Building Code37Cf. BR-Drs. 436/24.(Baugesetzbuch, BauGB) (cf. § 1c para. 5 no. 2 BauGB-E, § 7 para. 1 sentence 2 ROG-E). However, these plans have not been fleshed out in the proposals and will – in all probability – in case they should be adopted without changes by the new government and parliament not be sufficient: they are too vague and they lack a concrete implementation mechanism.
Key message 2.6: In general, the new German federal government’s implementation of the RED III should be based on the 2024 drafts. However, some improvements should be made. For example, the concept of “multifunctional land use” contained in Art. 15 RED III should be made operational. The 2024 drafts took up the concept but failed to provide the level of detail necessary to actually influence administrative practice.
2.2.3 The integration of renewable and low-carbon hydrogen in the EU ETS
Authors: Nils Bruch (TU Darmstadt), Falko Ueckerdt (PIK), Jana Nysten (Stiftung Umweltenergierecht), Michèle Knodt (TU Darmstadt)
The use of renewable hydrogen is considered an important element for the decarbonization of sectors that are hard to electrify, such as the steel and chemical industry or aviation. Therefore, hydrogen is a crucial element supplementing direct electrification and is essential to achieve climate neutrality in the European Union.38European Commission (2020): COM(2020) 301 final.
So far, the volume of renewable hydrogen produced by electrolysis with renewable electricity is negligible in comparison to conventional fossil-based hydrogen production.39IEA (2023): Global Hydrogen Review 2023, IEA, Paris, and European Hydrogen Observatory (2024): The European hydrogen market landscape, November 2023 (Report 01), Updated February 2024.This is mainly due to the high costs of renewable hydrogen production. Until the availability and competitiveness of renewable hydrogen improves to achieve the EU’s objective to develop a renewable hydrogen market, the use of non-renewable low carbon hydrogen is discussed in the EU and among researchers as a transitional solution to accelerate the market ramp-up of renewable hydrogen.40European Commission (2020): COM(2020) 301 final and European Commission (2021): COM(2021) 803 final.This is because the production of low carbon hydrogen, for example in the form of gas-based hydrogen with subsequent carbon capture and storage (referred to as blue hydrogen) will likely be cheaper than renewable hydrogen, while still less emissions intensive than conventional fossil hydrogen.41Hermesmann, M. / Müller, T.E. (2022): Green, Turquoise, Blue, or Grey? Environmentally friendly Hydrogen Production in Transforming Energy Systems, in: Progress in Energy and Combustion Science, Vol. 90, 100996, https://doi.org/10.1016/j.pecs.2022.100996 and Ueckerdt, Falko / Verpoort, Philipp C. / Anantharaman, Rahul / Bauer, Chistian / Beck, Fiona / Longden, Thomas / Roussanaly,Simon (2024): On the cost competitiveness of blue and green hydrogen, in: Joule, Vol. 8 (1), pp. 104-128, https://doi.org/10.1016/j.joule.2023.12.004.
A regulatory framework has been adopted at EU level for the production of renewable fuels of non-biological origin (RFNBOs), which includes renewable hydrogen, and the framework for low carbon hydrogen is awaiting the adoption of a delegated act specifying a methodology for assessing greenhouse gas emissions savings.42European Commission (2024): Methodology to determine the greenhouse gas (GHG) emission savings of low-carbon fuels, Have your say – Public Consultations and Feedback, https://ec.europa.eu/info/law/better-regulation/have-your-say/initiatives/14303-Methodology-to-determine-the-greenhouse-gas-GHG-emission-savings-of-low-carbon-fuels_en.
The published Ariadne analysis, “Low Carbon Hydrogen in the European Union – A Coherent Regulatory Framework”43Nils Bruch, Michèle Knodt (2024): Low carbon hydrogen in the European Union: A coherent regulatory framework. Kopernikus project Ariadne, Potsdam. https://doi.org/10.48485/pik.2024.012 , reveals that a comprehensive strategy for using low carbon hydrogen as a transitional solution to support the renewable hydrogen market ramp-up is lacking. Furthermore, it is key to integrate emissions from low carbon hydrogen throughout its entire lifecycle into the regulatory framework to ensure positive climate impacts, including emissions from imported low carbon hydrogen.
These rules are accompanied by market-based instruments, the central one being the European Union Emissions Trading System (EU ETS) for the reduction of GHG emissions in the EU. The latest reform of the EU ETS introduces the inclusion of all types of hydrogen production. Previously, only conventional fossil-based hydrogen produced via reformation and partial oxidation was covered. The European Commission justified the expansion by highlighting the need to create a level playing field between conventional fossil, low carbon and renewable hydrogen. This raises the question of how the reformed rules of the EU ETS impact the development of the hydrogen scale up.
Key Message 2.7: The pricing of emission in the EU ETS does not (yet) provide sufficient additional revenue to significantly narrow the cost disparity between renewable / low carbon hydrogen and natural gas.
Both renewable and blue hydrogen production costs will likely be dramatically higher than those of natural gas (Figure 1). Natural gas is the main competitor in many important hydrogen applications, for example in the energy-intensive industry or energy supply sectors. In 2025-2030, renewable hydrogen costs are estimated to be about 6 times as high as those of natural gas. Low-carbon blue hydrogen will likely be about 4 times as expensive as natural gas.
These cost gaps are only slightly reduced by the value of freely allocated emission certificates (green part in Figure 1) for hydrogen production in the EU ETS. The current CO2 prices are simply too low to create much of a difference in the very high hydrogen costs. This underlines that both renewable as well as blue hydrogen scale-up requires additional policies (e.g., subsidies or regulation).
Key Message 2.8: Extending the EU ETS to cover upstream emissions would more accurately internalize the climate impacts, leading to a fairer comparison between low carbon and renewable hydrogen.
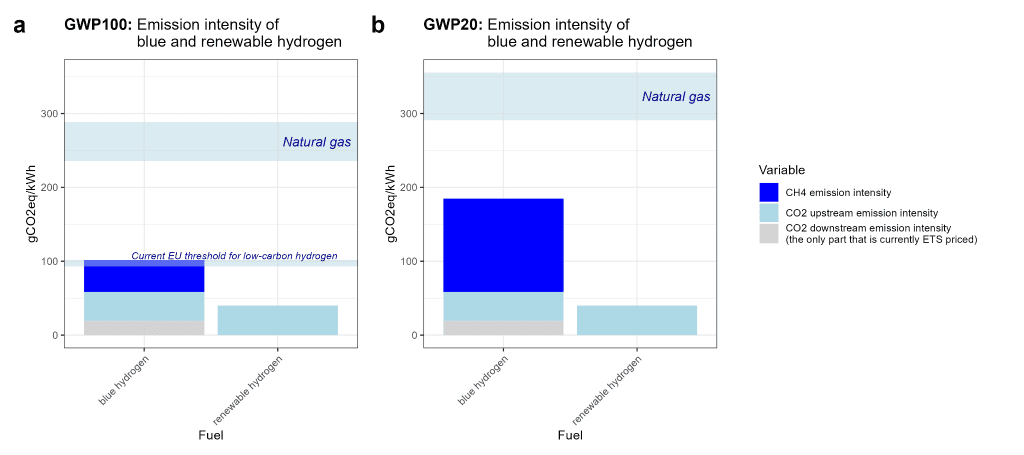
The current design of the EU ETS does not set sufficient incentives to reduce the emis-sions from blue hydrogen. As Figure 2 shows, a significant share of emissions from blue hydrogen stem from methane emissions caused in the upstream operations, especially during natural gas production and transport. Since methane emissions are not priced under the EU ETS, the overall carbon footprint of gas-based hydrogen production is not fully accounted for. This undermines the effectiveness of the EU ETS in reducing the cli-mate impact across the hydrogen value chain. To address methane emissions in the EU regulatory framework, the Methane Regulation (EU) 2024/1787 introduces reporting, monitoring and reduction obligations for fossil fuel producers. While this is a first step to close the regulatory gap, it falls short on directly pricing methane emissions, which would be necessary to fully integrate these emissions into the EU ETS framework.
To effectively support the market ramp-up of renewable hydrogen and achieve higher emissions reductions, additional policy measures are necessary. These should include targeted support programs for renewable hydrogen, stricter emissions thresholds and the integration of upstream emissions (including methane) into the EU ETS framework. Without such measures, the EU risks falling short on its objective to build up a renewable hydrogen economy that ensures the achievement of its climate goals.
2.3 Arbitrage vectors and distortionary overlaps
The European Union’s transition to net zero demands a comprehensive reassessment of its climate policy architecture to ensure the efficient allocation of scarce resources. Current policies – which have evolved over time and stem from complex political decision-making processes – are characterized by fragmentation and overlapping regulatory mechanisms, creating significant inefficiencies and mixed signals. This raises crucial questions about the coherence and effectiveness of the EU’s approach, as well as the risks it entails for achieving climate goals. By introducing the concept of arbitrage vectors, the following analysis in Section 2.3.1 explores how fragmented compliance mechanisms distort resource allocation and proposes pathways toward gradual convergence, emphasizing the necessity of an economy-wide carbon pricing framework to enhance efficiency and investor confidence. Section 2.3.2 then focuses on overlaps between the ETS I, the ETS II and the ESR to empirically illustrate effects of such a fragmentation.
2.3.1 Unblocking arbitrage vectors in the EU’s climate policy architecture
Authors: Darius Sultani (PIK), Conall Heussaff (Bruegel), contributing: Georg Zachmann (Bruegel), Michael Pahle, Sebastian Osorio (PIK)
The transition to net zero begs the question of efficient allocation of scarce resources (land, labor, capital) across sectors and technologies. This requires substantial investments, but uncertainties are high regarding how much and in which sectors. Up until now, the EU climate policy architecture creates incentives for fragmented capital allocation both between sectors – i.e. through different compliance mechanisms (ETS, ESR, LULUCF, …) – and within sectors (e.g. EPBD in buildings). The current EU policy strategy, which historically evolved sends mixed signals, which build up tension in the policy architecture.
Key message 2.9: EU climate policy architecture is fragmented and implies mixed signals: While carbon pricing is set to become more overarching and economy-wide (converging signal), new mechanisms are still put in place to keep compartmentalisation intact (diverging signal).
This begs the following questions: What exactly is the EU’s current approach, and what are the risks associated with it? Given these risks, what new approach (instruments) is advisable?
The role of arbitrage vectors
In order to assess the EU’s current policy approach towards its climate policy architecture, we introduce the concept of arbitrage vectors.
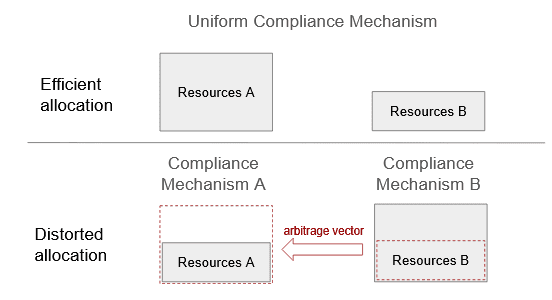
Key message 2.10: An arbitrage vector represents the opportunity to reduce distorted (inefficient) resource allocation that arises from fragmented compliance mecha-nisms (e.g. sector-specific targets).
This definition implies two main features of an arbitrage vector:
- Size: How large a vector is depends on distortion created by fragmented regulation. The smaller a vector, the higher the convergence of marginal abatement costs in different compliance systems.
- Channel(s): Arbitrage vectors imply that a specific type of resource and related flows are misallocated. We label such a resource as the vector’s channel. Important examples are electricity, hydrogen and biomass.
Current policy approach and risks associated with it
From our analysis of a number of examples in this Ariadne product, we can conclude that the current architecture does not follow a coherent single approach, but rather a mix of several approaches on different levels. All in all, pathways to integrate several compliance schemes into an economy-wide carbon market are indeed still avoided.
Such a mix of approaches becomes problematic when regulatory regimes evolve into “bureaucratic monsters”. This is the case if continuous add-ons to existing regulation in an attempt to control arbitrage vectors build up over time, and lead to an increasingly overwhelming regulatory burden. Challenges arise for companies due to rising compliance cost, and there is an increasing risk of policy evasion, for example by re-directing supply chains through certain compliance mechanisms to maximise profits (“EU-internal resource shuffling”). From a policy perspective, the main challenge lies in the information requirements to set regulatory parameters right. This is especially the case in light of limited policymaking capacity.
Overall, we identify three central risks the current policy approach runs into. First, there is the risk of increasing tension in the architecture. This risk is intensified by a long-term perspective of a uniform carbon price, which becomes self-enforcing as soon as the expectation of an integration becomes a driving force. From this point onwards, substantially different prices (abatement cost) between compliance mechanism – i.e. maintaining fragmentation – are politically difficult to sustain. Second, upholding fragmentation with mixed approaches bears the risk of distortion, especially in the face of uncertainty when ambition rises and marginal abatement cost curves become convex. Third, there is the risk of policy failure when the combination of information asymmetries and a lack of policy capacity as described above plays out such that arbitrage vectors unfold uncontrollably.
Alternative approach: Gradual convergence through arbitrage vectors
Key message 2.11: Instead of maintaining fragmentation with a set of uncoordinated policy approaches, policy should aim for gradual convergence of compliance mecha-nisms towards a long-term vision of economy-wide carbon pricing.
Arbitrage vectors should be instrumentalised by policies to work towards gradual convergence. While they are hard to control with regulatory measures like command-and-control, market-based gradual convergence measures such as exchange rates are an alternative way forward. While releasing architectural tension in a controlled way, they have the advantage of providing visibility (as part of price signals) and simplicity, which in turn enhances investors’ certainty in developing business cases.
2.3.2 Fragmented and Overlapping Carbon Markets in the EU
Authors: Sebastian Rausch (ZEW-Leibniz Centre for European Economic Research and Heidelberg University), Jan Abrell (University of Basel)
Governments around the world increasingly rely on emissions trading systems (ETSs) to put a price on greenhouse gas emissions. The defining feature of this regulatory approach is flexibility, which creates incentives for emissions reductions where they are most cost-effective. At the same time, no region or country has yet introduced a comprehensive ETS that covers all emissions within a jurisdiction’s economy. Historically, ETSs were devised with a clear sectoral focus, for example to decarbonize the energy and power sector. As economies around the world pursue increasingly ambitious economy-wide decarbonization targets, the sectoral coverage of ETS will inevitably expand. However, a single carbon market covering all emissions within a single jurisdiction is still a long way off for most regions and countries. In the transition to climate neutrality, it is therefore all the more important to understand the interactions between several coexisting emissions markets in order to improve their economic efficiency.
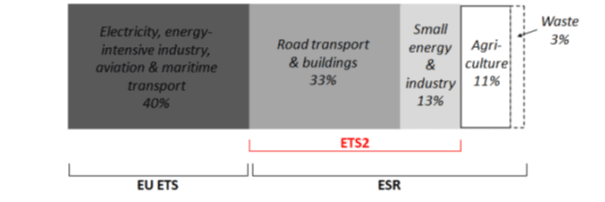
The EU, with one of the world’s largest carbon markets, is a prime example. The EU Climate Law of 2021 establishes an ambitious and binding commitment of the Union and its Member States to reduce economy- and EU-wide emissions, ultimately aiming to achieve net-zero emissions by mid-century. The EU’s carbon market is characterized by significant fragmentation and overlap. The EU’s carbon budget is divided among the EU Emissions Trading System (EU ETS), the Effort Sharing Regulation (ESR) at the national level, and the future second emissions trading scheme for combustion emissions outside the EU ETS – mostly buildings and road transport, but also small industry (ETS2). At the same time, emissions covered by the ETS2 fall completely under the ESR, resulting in double regulation.
While it is well-known that the fragmentation of emissions markets creates efficiency losses, overlapping emission markets have received surprisingly little attention in the literature. This sub-chapter analyzes the efficiency and distributional consequences of fragmented and overlapping carbon markets (excluding the possibility that the first-best solution of a fully integrated market is feasible).44Jan Abrell and Sebastian Rausch (2024). Fragmented and Overlapping Carbon Markets in Europe. mimeo.Specifically, we analyze the economic effects of the new ETS2—EU-wide and country-specific aggregate welfare and equilibrium carbon prices—, also scrutinizing how outcomes depend on ESR trading. We analyze the conditions under which the new ETS2 is effective (or under which it becomes a “toothless tiger”), its interaction with the ESR system and implications for the allocation of carbon abatement and carbon prices. We examine how large the foregone efficiency gains would be if ETS2 is not effective, and how costly the remaining fragmentation would be if ETS2 turns out to be effective. Lastly, we gauge the cross-country distributional effects for the various policy scenarios considered. Methodologically, we base our analysis on a novel quantitative empirical structural equilibrium model of EU carbon markets which is embedded in a macroeconomic general equilibrium framework calibrated to the EU economy to perform both positive and normative economic analyses of the current and future architecture of carbon pricing in the EU.
Key message 2.12: The fragmentation of EU’s carbon markets runs along two dimensions (EU ETS vs. ETS2 vs. ESR), and there exist unequivocal empirical evidence that flexibilities, which are already in place in the current regulatory setting and could help to overcome fragmentation, have not been used in the past (e.g., virtually no cross-country trade in Annual Emission Allowances (AEAs), partial over-allocation in ESR at the country level). Moreover, ETS2 emissions are a strict subset of ESR emissions: emissions covered by ETS2 are also entirely covered by the ESR, i.e. there is a 100 % overlap (see Figure 4). ETS2 emissions are therefore subject to double regulation.
Together, limited AEA trade and partial over-allocation suggest a limited use of AEAs in exploiting locational-flexibility to overcome the national allocations hard-wired into the ESR system—even though such flexibility is not constrained per se by the regulation.
Key message 2.13: Given a complete overlap between the ESR and ETS2 (in line with empirical evidence and the reality of regulation), the introduction of the new ETS2 will have no effect on the allocation of emissions (i.e., emissions reductions) and thus on cost-effectiveness if no trading of ESR emissions permits is possible.
This result has an important implication: if AEAs in the ESR cannot be traded, the new ETS2 will not lead to an equalization of marginal abatement costs across countries. This would only be the case if national emission reduction targets happened to be chosen just so that marginal abatement costs would be aligned ex-post—which is completely unrealistic, since the regulator would need to know abatement costs and market actor behavior. Thus, the introduction of ETS2 yields no efficiency gains as would generally be expected from emissions trading. All efficiency gains stem from AEA trade (and the higher the degree of AEA trade, the higher are efficiency gains).
Key message 2.14: Implicit upper bound on equilibrium carbon price in ETS2: If no trading of ESR emissions permits (AEAs, Annual Emissions Allowances) is possible, and assuming a complete overlap between the ESR and ETS2, the equilibrium price of emissions permits in the new ETS2 cannot exceed the minimum of (implicit) ESR carbon prices among EU Member States.
The intuition behind this result is as follows. If the ETS2 price would be larger than the minimum of ESR prices, this would imply that the lowest-cost country abates more than its ESR target, in turn rendering the equilibrium conditions for the ETS2 market non-binding (given that, due to no AEA trading, other countries’ abatement is unchanged). This would imply that the ETS2 market is slack, with an equilibrium price of zero, which is a contradiction. Moreover, Key message 3 has an important corollary: Given that in the past the allocation of ESR emissions budget for some countries was rather generous (likely due political concerns about adverse distributional impacts), the potentially stark implication is that if the ESR emissions constraint is non-binding for at least one country, the equilibrium carbon price of tradable permits in the new ETS2 is zero. Thus, the double-regulation in combination with the “over-allocation in the ESR” can destroy the price mechanism in ETS2. This is likely to be less of an issue for more stringent, future policy targets under which over-allocation in the ESR may not be an issue anymore.
Key message 2.15: An effective ETS2 would yield aggregate efficiency and distributional gains that are quantitatively significant. Put differently: the economic costs of an ineffective ETS are significant.
- If where-flexibility among emissions regulated by ESR is fully exploited (i.e., unlimited AEA trading), ETS2 yields sizeable efficiency gains (i.e., 16-22 % of policy costs can be saved),
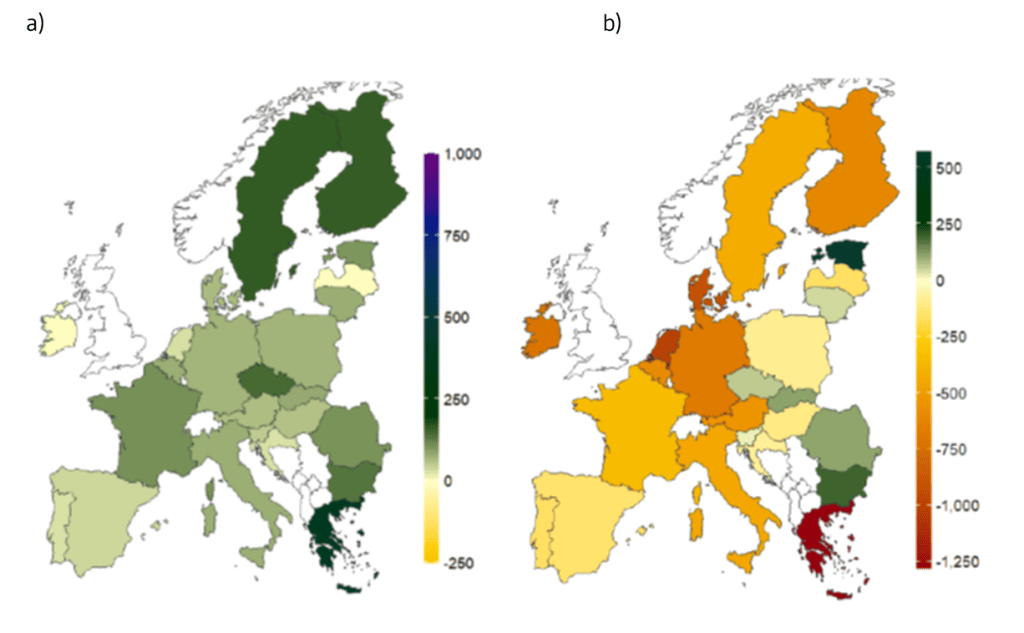
- In the absence of trading in ESR emission allowances, the double regulation hinders the reduction of carbon price fragmentation, foregoing welfare gainsfor essentially all EU countries; put differently, virtually all countries gain from introducing an “effective” ETS2 (compare Figure 5a to Figure 5b).
- Introducing an effective ETS2 would bring about a significant relaxation of the carbon price pressure.
- Despite the non-integrated EU ETS and ETS2 systems, an effective ETS2 would achieve 81-98 % of the maximum efficiency gains possible with a single carbon price across Europe.
2.4 Carbon market stability
Authors: Sebastian Osorio (PIK), Frederik Schmitz (UH), Michael Pahle (PIK), Grischa Perino (UH)
With the implementation of the Emission Trading System for buildings, transport and other sectors (ETS2) from 2027 on, around 80 % of all EU emissions will be regulated under the ETS. More broadly, the ETS is bound to become the major compliance mechanism to achieve the EU’s climate targets post-2030. To ensure the ETS delivers on this, market stability and the mechanisms to ensure it are very important. The Ariadne project conducts research to that end by assessing if current mechanisms are “fit for that purpose”, and in case they are not, what changes might be commendable.
Key message 2.16: Going forward, the current stability mechanism (and its rule) is likely to be of limited effectiveness, mainly because of how it deals with shocks/distortions/uncertainty (including the sensitivity of banking on the discount rate).
Currently, two measures exist to improve carbon price stability: The Market Stability Reserve (MSR), a supply adjustment mechanism that responds to changes in the number of allowances banked for future use, and Article 29a of Directive 2003/87/EC that provides measures in the event of excessive price fluctuations, triggering the release of additional allowances to the market. Due to space limitations, the analysis is confined to two central questions regarding the efficacy of the MSR45For more detailed assessments please refer to Borghesi, S., Pahle, M., Perino, G., Quemin, S., & Willner, M. (2023). The market stability reserve in the EU emissions trading system: a critical review. Annual Review of Resource Economics, 15, 131-152 and Perino, G., Willner, M., Quemin, S., & Pahle, M. (2022). The European Union emissions trading system market stability reserve: does it stabilize or destabilize the market? Review of Environmental Economics and Policy, 16(2), 338-345.:
1. In its current form, is the MSR capable of mitigating shocks to the EU ETS?
2. What range of allowances in circulation corresponds to a “stable” market?
According to literature, the MSR is generally well-suited to deal with unexpected shocks such as the early stages of the Covid-19 pandemic.46Gerlagh, R., Heijmans, R. J., & Rosendahl, K. E. (2020). COVID-19 tests the market stability reserve. Environmental and Resource Economics, 76, 855-865.An unexpected and immediate reduced demand for allowances translates into a higher total number of allowances in circulation (TNAC) that is subsequently absorbed and invalidated by the MSR. However, Rosendahl (2019)47Rosendahl, K. E. (2019). EU ETS and the waterbed effect. Nature Climate Change, 9(10), 734-735.points out that complications arise if changes in allowance demand or supply are anticipated and only manifest after the MSR has become dormant due to a shrinking TNAC (projected to happen by 203048Pahle, M., Quemin, S., Osorio, S., Günther, C., & Pietzcker, R. (2025). The emerging endgame: the EU ETS on the road towards climate neutrality. Resource and Energy Economics, 101476.).The announcement of policies reducing the demand for allowances with large planning horizons such as the phase-out of coal power plants in an EU Member State is a commonly cited example for such a scenario.49Perino, G., Pahle, M., Pause, F., Quemin, S., Scheuing, H., & Willner, M. (2021). EU ETS stability mechanism needs new design. CEC Dauphine Policy Brief, 655.As the TNAC is not only a reflection of short-term allowance demand and supply but also of the long-term banking strategies, changes in future market conditions impact the current TNAC. The allowances freed-up in the future will not be absorbed by the then dormant MSR if changes in allowance demand manifest after 2030, lowering expected market tightness, reducing the incentive to bank allowances and causing the TNAC to contract today. As a consequence, fewer allowances will be invalidated by the MSR, further decreasing expected scarcity and, hence, prices. In fact, changes in the TNAC systematically point in the wrong direction for anticipated shocks50Perino, G., Willner, M., Quemin, S., & Pahle, M. (2022). The European Union emissions trading system market stability reserve: does it stabilize or destabilize the market? Review of Environmental Economics and Policy, 16(2), 338-345.causing the MSR to amplify price volatility instead of dampening it in such a scenario. Furthermore, a so-called “Green-Paradox” can occur where the net-effect of a policy decreasing future allowance demand is to increase the emission cap, depending on the timing of its announcement and implementation.51Borghesi, S., Pahle, M., Perino, G., Quemin, S., & Willner, M. (2023). The market stability reserve in the EU emissions trading system: a critical review. Annual Review of Resource Economics, 15, 131-152.The underlying issue is not the endogeneity of the cap per se, but the use of the TNAC as a scarcity indicator in combination with fixed thresholds that do not adapt to shrinking supply.
Another complication of a TNAC-based indicator for market stability is the variety of actors holding allowances. Motives vary from hoarding to hedging or speculation. It is, therefore, unclear which changes in the TNAC constitute a “threat” to market stability and should be counteracted by the MSR. Furthermore, even when only focusing on compliance firms, different discount rates can lead to vastly different levels of allowance banking, making the use of predetermined thresholds problematic.
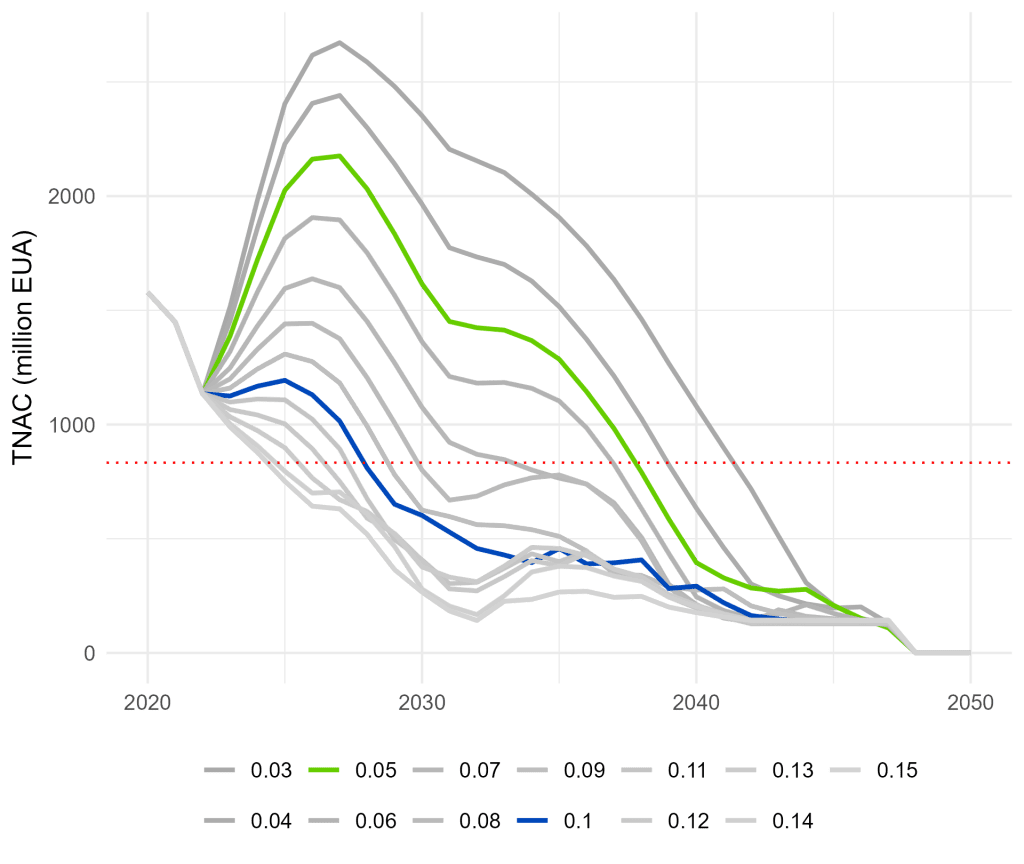
We assess the impact of varying discount rates on market actors’ banking behavior through a numerical model of the ETS 1, LIMES-EU. In this model, firms are allowed to bank allowances between years without restriction, i.e., allowance prices are linked over time and rise at the discount rate due to intertemporal arbitrage.52Rubin, J. D. (1996). A Model of Intertemporal Emission Trading, Banking, and Borrowing. Journal of Environmental Economics and Management, 31(3), 269–286.Different levels of farsightedness are modeled through different discount rates (see Figure 6). Large differences can be observed in the TNAC, which ranges from 265 to 2350 million allowances for discount rates between 3 % and 15 %. For more moderate discount rates, namely between 5 % and 10 %, the TNAC range remains wide (between 600 and 1615 million EUA). A high discount rate implies a low weight is put on future costs (i.e. high prices) and vice versa. As a result, a high discount rate leads to little banking in anticipation of future scarcity, keeping prices low initially, which in turn causes reduced short-term abatement. In the long-term, nonetheless, allowance prices rise sharply over time given the steep efforts to fully decarbonise the EU ETS. Overall, high discount rates lead to less MSR intake and thus fewer cancellations.
The policy implication from such wide TNAC ranges is that it is challenging to determine an adequate MSR “hedging corridor”. The TNAC volume does not show the effectively available volume for trade in the market (the so-called “float”) vs. the volume locked in for hedging operations and other purposes. This is particularly important as the future discount rate of firms is uncertain given the unpredictability of its components (i.e. firm performance, general interest rates, policy risk). Such uncertainty and its effects on future allowance prices and emissions highlight the need for careful consideration of market actors’ farsightedness in policy design, for instance, when determining adequate MSR thresholds for the future. The hedging corridor calibration issue could potentially be addressed by making the MSR thresholds for intake and outtake dynamic and using more refined indicators. However, the MSR in its current state acts rather as a reinforcing mechanism of anticipated scarcity. Replacing it with a more suitable mechanism seems advisable.
Key message 2.17: Making the stability mechanism fit for the endgame53With the emissions cap designated to go down to zero by around 2040, the next decade can be said to mark the `ETS endgame’, i.e., when allowance supply approaches zero. See Pahle et al. (2025), for more details on the fundamental changes the EU ETS is bound to undergo (Pahle, M., Quemin, S., Osorio, S., Günther, C., & Pietzcker, R. (2025). The emerging endgame: the EU ETS on the road towards climate neutrality. Resource and Energy Economics, 101476.). requires rethinking their rules and indicators, especially with regard to the potential of prices.
The above findings highlight the role of (intertemporal) banking decisions for both the efficiency of the ETS and thus also for market stability and the MSR. Further theoretical work looking at additional aspects corroborates the potential drawbacks of the MSR in its current design in that regard. Specifically, it increases the vulnerability of the EU ETS to market sentiments54Perino, G. (2024). Carbon market design and market sentiment. Journal of Environmental Economics and Management, 128, 103057.because supply adjustment based on past allowance banking (TNAC) reduces the market’s ability to contain the impact of distorted expectations by some market participants on prices. Moreover, in the presence of informational and capital frictions, using the TNAC as an indicator and fixed (static) thresholds to trigger intake and outtake cannot appropriately differentiate between allowances held for hedging purposes and allowances held for other purposes.55Pahle, M., Quemin, S., Osorio, S., Günther, C., & Pietzcker, R. (2025). The emerging endgame: the EU ETS on the road towards climate neutrality. Resource and Energy Economics, 101476.
In light of that, more work is needed in two directions. First, new indicators are wanted that better capture the “true state” of banking (expected allowance scarcity and hedging). A particular challenge is that using market prices can also be “biased”, i.e. when the price itself is distorted and does not reflect long term scarcity.56Sitarz, J., Pahle, M., Osorio, S., Luderer, G. & Pietzcker, R. (2024). EU carbon prices signal high policy credibility and farsighted actors. Nature Energy 9, 691–702.Accordingly, new indicators (either price or quantity based) need to be developed to better disentangle the various price or banking components. Second, a dynamic rule is wanted that would automatically adjust to the continuously tighter cap and changing market conditions and shocks. While new rules on how to deal with shocks have been proposed by e.g. Karp & Traeger (2024)57Karp, L. & Traeger, C. (2024). Taxes versus quantities reassessed. Journal of Environmental Economics and Management, 125, 102951.,the question remains how the triggers formulated in these rules can be measured empirically (see above). Recent research58Benmir, G., Roman, J & Taschini, L. (2024). Weitzman Meets Taylor: EU Allowances Futures Price Drivers and Carbon Cap Rules. mimeo.considers this issue by aiming to separate fundamental form sentiment factors that drive prices, but a lot of open questions remain in terms of the stability of the rules in light of the ever-tighter cap and the empirical identification of sentiment. Furthermore, an agreement on which specific criteria a market stability mechanism is supposed to meet and why would be an important precondition to then develop a marked design and empirical indicators to achieve them. If, for example, the aim is to reduce price fluctuations regardless of their origin, then an option might be to develop Art. 29a (30h for ETS 2) into a more sophisticated mechanism that adjusts allowance supply based on price changes.59Willner, M. & Perino, G. (2022). An Upgrade for the EU ETS: Making Art. 29a and 30h fit for effective price containment. Universität Hamburg Policy Brief.
2.5 Electricity prices and the role of hydrogen trade
Authors: Sebastian Osorio, Michael Pahle (PIK), Jonas Egerer, Veronika Grimm, Natalia Goryashchenko (UTN)
National energy prices are important for the future competitiveness of the European economy. This chapter focuses on the impact EU-hydrogen production and trade has on electricity prices. Two scenarios with and without hydrogen trade in Europe show the implications on national electricity prices and regional hydrogen production.
We employ a modeling framework consisting of two complementary models: LIMES-EU for a comprehensive long-term view of EU ETS dynamics and power sector decarbonization pathways, and the UTN electricity market model for hourly optimization. By integrating the models, we can assess the impact of different market settings on short-term electricity price formation while accounting for long-term investments in electricity and hydrogen production in line with current (and potential) EU ETS ambition.
Key Message 2.18: The gains of hydrogen trade within Europe are high, but distributional implications can be shown for electricity markets. Countries that export hydrogen in a pan-european H2 market will incur higher electricity prices.
Our results in the trade scenario, with a minimum of 20 % in national hydrogen production, show that more electrolyser capacity is placed in Scandinavia and the British Isles. While in these places, hydrogen costs range between 2 and 3 EUR/kg already in 2030, the rest of the EU has costs above 4 EUR/kg, these being particularly high in southern and Eastern Europe (see Figure 7). By 2040, the model results show a substantial drop in costs as all countries produce hydrogen between 1.5 and 2.9 eur/kg. Despite the decrease of costs, on average, from 5.0 to 2.6 eur/kg between those years (see right panel of Figure 7), the hydrogen market benefits from the availability of a widespread H2 trade infrastructure, reducing costs by 15 % to 20 %.
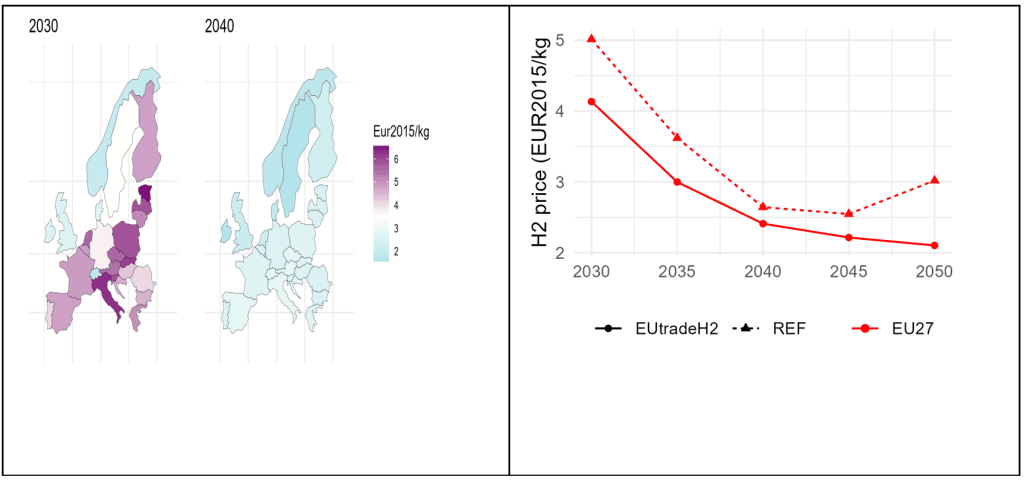
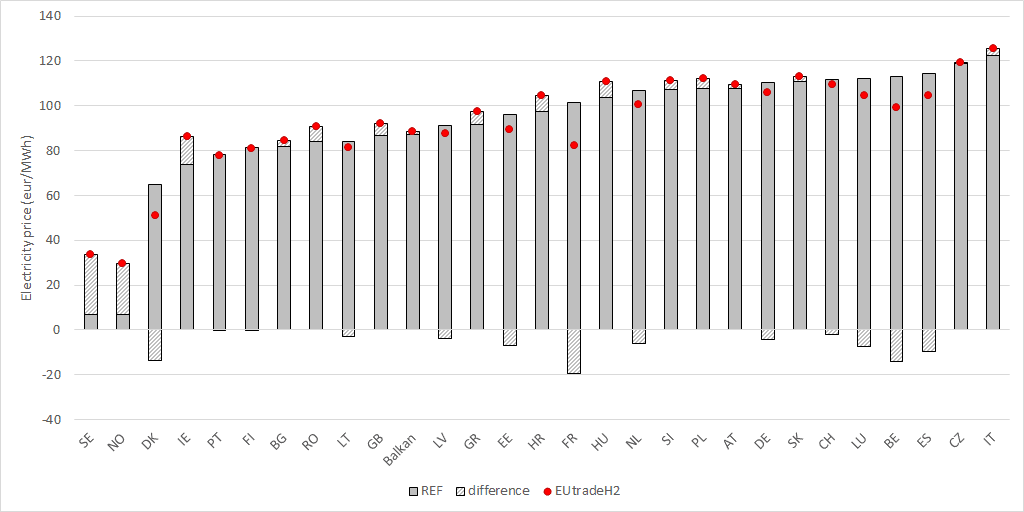
The nordics and British Isles become net exporters in both 2030 and 2040 in a highly integrated hydrogen market. Indeed, most countries maintain their status either as net importers or net exporters in that period, highlighting that the competitive advantage of low electricity prices is not temporary but reinforced over time. As a result, most countries import up to 80 % of their hydrogen consumption. However, the development of a European hydrogen market with exports from countries with the lowest cost, implies that electricity prices increase in these countries (Figure 8). However, these prices remain low compared to neighboring continental European countries, where some countries observe electricity price drops due to lower national hydrogen production.
Key Message 2.19: A European hydrogen market could reduce the continent’s dependencies on energy imports from outside Europe.
Our results show the benefit of more integrated energy markets and, in particular, highlight to what extent hydrogen costs might decrease in the presence of EU hydrogen trade. However, such a development implies an increase of electricity prices for net exporters of hydrogen. While these countries would benefit from the revenues of developing an industry that is projected to have increased demand, their electricity costs might increase substantially, potentially affecting other industries and households. The assessment of this development also reveals both promising opportunities of market integration and notable challenges for net importers of hydrogen. On the one hand, as compared to a higher national production capacity, they would benefit from lower electricity prices. On the other hand, becoming a hydrogen net importer might be controversial, as current fossil fuel dependency has raised sovereignty concerns. In this context, however, it is important to observe, that home-production of the needed hydrogen quantities is unrealistic for these countries and given this, import from other EU member countries is preferable as compared to increased imports from outside the EU.
This conundrum only becomes more complex when considering the potential options and policy initiatives that affect institutions and thereby the economic framework. To what extent the EU should fund the H2 network development? What could an EU hydrogen market design look like? To what extent concepts of national energy security should be redefined, also against the background of national sovereignty concerns? While it is clear that a pan-European H2 network would bring EU-wide benefits and improve EU industry competitiveness, funds might also be used to address some of the distributional issues that arise. At the same time, hydrogen is essential for the transition of the European industrialized economies, for which there are clear quantity commitments. Therefore, reasonable but clear rules are required for the upcoming ramp-up period, during which hydrogen supply might be scarce.
2.6 System analysis of 2040 climate target
The European Commission is developing a 2040 climate target to bridge the gap between the 2030 goal of a 55 % GHG reduction and achieving full climate neutrality by 2050. This study leverages the REMIND-EU model to explore cost-efficient pathways for GHG reduction, focusing on key variables such as energy demand, bioenergy, CCS, and renewable deployment. The results highlight the feasibility of deep emission cuts, driven by rapid expansion of wind and solar power, increased electrification, and limited deployment of hydrogen and CCS.
2.6.1 EU-level analysis
Authors: Robert Pietzcker (PIK), Conall Heusaff (Bruegel), Renato Rodrigues, Gunnar Luderer (PIK)
The EU commission has started the process of setting a climate target for 2040 to guide the transition from the 2030 target of 55 % GHG emission reductions to full climate neutrality in 2050. Using the REMIND-EU energy-climate-economy model, we explore cost-efficient GHG emissions and transformation milestones for 2040 that are consistent with the near-term energy and climate policy framework established by the EU Green Deal60Rodrigues et al, under review: “2040 greenhouse gas reduction targets and energy transitions in line with the EU Green Deal”. Preprint: https://www.researchsquare.com/article/rs-3192471/v1. A range of sensitivity scenarios are implemented to provide a robust analysis of the decarbonization trajectories, exploring six different dimensions: 2030 emissions reductions, evolution of final energy demand, availability of bioenergy / CCS / hydrogen & synthetic fuels, and deployment speed of wind and solar.
The stringent energy system transformation (scenarios S2 and S3, reaching 88 % and 92 % GHG emission reduction in 2040, respectively) depicted in the European Commission’s 2040 target impact assessment61European Commission: SWD (2024) 63 final. “Europe’s 2040 climate target and path to climate neutrality by 2050”. https://eur-lex.europa.eu/legal-content/EN/TXT/?uri=CELEX%3A52024SC0063. align well with the REMIND results of 85-92 % emission reductions. The narrative is consistent and technically feasible: a massive expansion of wind and solar generation technologies will supply clean electricity to Europe, while widespread electrification of energy services like heating and transport will utilize this clean power, leading to a rapid reduction in fossil fuel use and associated emissions.
Both the European Commission’s modeling and the REMIND scenarios project that wind and solar electricity generation needs to increase more than seven-fold from 2019 to 2040. While this might appear daunting, the necessary growth of annual deployment is less than what was achieved during 2021-2023, indicating that this target is realistic and attainable – if the supporting regulatory changes of the last years are not reversed.
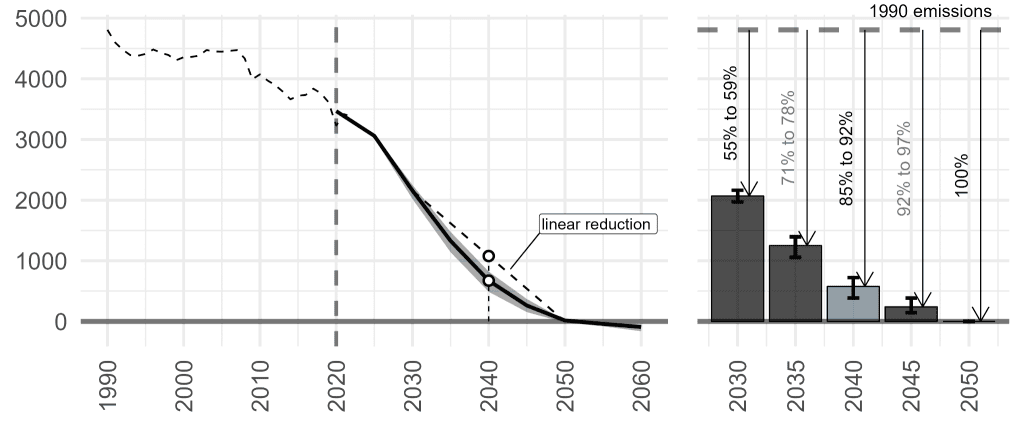
The increase in clean electricity mainly from wind and solar can replace fossil fuels in various sectors of the economy, such as oil in transport and gas in heating, through the electrification of end-use sectors via battery-electric vehicles and heat pumps. The share of electricity in final energy demand is expected to more than double until 2040 with respect to 2019 and reach 50 %-60 % by 2050, highlighting the pivotal role of electricity in the future clean energy economy. Beyond this major shift towards electricity, emission reductions are achieved by a (limited) upscaling of hydrogen/synfuel use and carbon capture and storage. Total CCS reaches 200 MtCO2/yr in 2040 in the default scenario, implying very strong upscaling challenges in the 2030s.
Under default assumptions, the carbon prices required for this transformation increase from 150EUR/tCO2 in 2030 to 250EUR/tCO2 in 2040 and 350EUR/tCO2 in 2050. This assumes that complementary policies such as CO2 emissions standards in road transport are upheld over the coming years – otherwise, much higher carbon prices will likely be needed.
Key message 2.20: EU-wide 2040 GHG emission reductions of 85-92% are in line with reaching climate neutrality in 2050 in a cost-optimal way, and seem achievable mainly based on i) fast upscaling of wind and solar power to provide clean electricity, ii) electrifying energy demand in all sectors, iii) limited deployment of hydrogen & synfuels as well as carbon capture and storage.
2.6.2 Country-level analysis
Authors: Markus Blesl, Fabian Ostertag, Dimitrios Tsoutsoulopoulos, Peiwen Zhang (IER)
The country specific analysis was conducted using TIMES PanEU – a bottom up optimization model of the European energy system. Four different scenarios were analyzed to assess the target of the EU for the greenhouse gas emissions in 2040. The first three scenarios resemble the scenarios which were set up for the impact assessment study of the European Commission.65European Commission: COMMUNICATION FROM THE COMMISSION TO THE EUROPEAN PARLIAMENT, THE COUNCIL, THE EUROPEAN ECONOMIC AND SOCIAL COMMITTEE AND THE COMMITTEE OF THE REGIONS. Securing our future. Europe’s 2040 climate target and path to climate neutrality by 2050 building a sustainable, just and prosperous society. SWD(2024) 63 final. Strasbourg, 6.2.2024.This means that the target for 2040 is in scenario S1 78 %, in S2 88 % and in S3 92 % reduction compared to 1990. The scenario 4 S2.5 reflects the target which is proposed now by the European Commission (90 % in 2040 compared to 1990).
The scenario analysis was done without emission constraints for ETS and ESR for the timeframe between 2035 and 2050. Caps for ETS and ESR have not yet been established for this period. Therefore, the model will be able to calculate the optimal distribution of emissions over the sectors in 2040 endogenously.
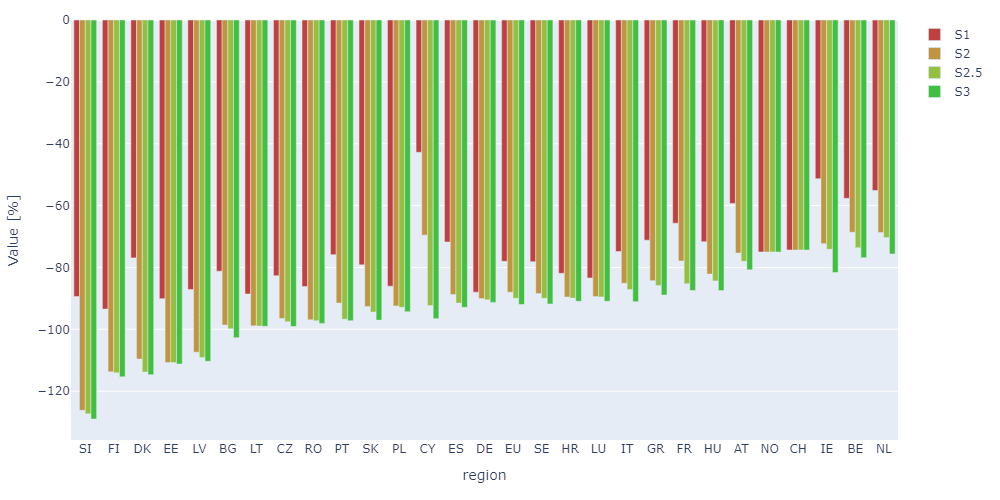
Significant differences exist among member states both in absolute values and across scenarios. Differences between the scenarios concentrate on the speed of transport sector decarbonization and the potential deployment of CCS, both of which seem to be relatively sensitive to the strictness of the 2040 GHG targets.The share of the final energy demand of Agriculture and Industry within a country’s total final energy demand influences the potential and pace of emission reductions. For example, in Slovenia (SI), Finland (FI) and Denmark (DK) the reduction targets are overachieved, and there is a notable difference between S1 and S2 scenarios. These countries benefit from the possibility of using Biomass CCS and from a moderate share of final energy demand in industry. On the other hand, in Germany (DE), which has a high share of industrial energy demand, the difference between S1 and S2 is relatively small. Countries like Austria (AT), without CCS options, or Ireland (IE), with a large agricultural sector, tend to underperform in meeting the reduction targets.
The marginal cost of GHG emissions in 2040 varies significantly across scenarios, ranging from 120 €2010/t CO2-eq. in scenario S1 to 387 €2010/t CO2-eq. in scenario S3, providing an indication of the expected CO2 prices in these scenarios. In 2050 the marginal costs reach approximately 420 €2010/t CO2-eq. across all four scenarios. The CO2 price levels are achieved because all EU-wide reduction options are integrated.
Net electricity generation across the EU is projected to grow from 2,800 TWh in 2020 to between 4,500 TWh and 5,400 TWh in 2040. The main differences in electricity generation among scenarios occur from varying levels of use of photovoltaic, onshore and offshore wind, and biomass. Biomass with CCS plays a crucial role in offsetting unavoidable process emissions from the agricultural and industrial sectors.
The share of electricity sources by country in 2040 varies significantly between member states, reflecting diverse approaches to renewable energy and nuclear power.
Due to the functioning electricity market, countries such as Austria (AT) operate storage facilities and install additional biomass capacities, while Spain (ES) utilizes CSP and PV to export electricity. In countries like Poland (PL) and Spain (ES), the use of biomass with CCS also exceeds the EU target. However, this requires the development of an instrument that creates a balance between the electricity market and the negative CO2 market, while ensuring investment security.
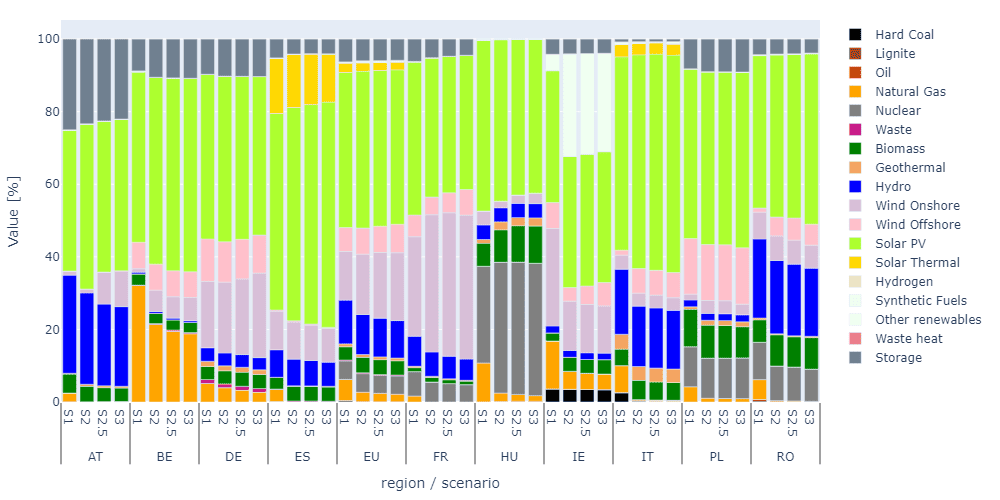
A comparison of the Final energy consumption in the EU shows a relatively low variance of the total final energy consumption between scenarios. Regardless of the reduction target, electricity accounts for approximately 45 % of the EU’s final energy consumption. The main differences arise from the level of use and the faster deployment of bio- and e-fuels, depending on a more ambitious target.
By 2040, the share of energy carriers in final energy consumption shows significant differences in electrification levels among member states – much greater than between scenarios. Similarly, the shares of biofuels, e-fuels and petroleum vary considerably across member states, influenced by the industrial composition of each country. For example, the use of e-fuels, hydrogen and petroleum – both for energy and non-energy purposes – depends heavily on a country’s industrial structure.
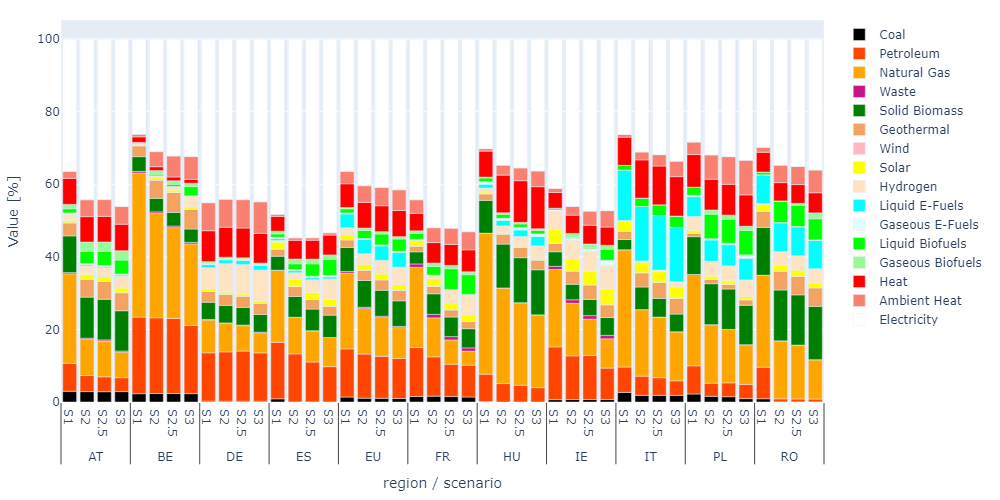
Key message 2.21: With EU-wide cost optimization we get significant differences in the percentage reductions in the composition of Final energy consumption and the shares of electricity sources at the country level achieved by 2040 compared to 1990.
A successful transformation requires an in time substitution of non-energy consumption. To achieve climate neutrality, new instruments must be introduced to integrate negative emissions into the market and balance the material and energy consumption of resources.
Key Message 2.22: New instruments that introduce negative emissions into the market and create a balance between material and energy consumption of energy sources are necessary to make the overall system climate-neutral.
3. Finance
3.1 Conceptual clarification: Scope and issues
Authors: Nikolas Messerschmidt, Ulrich Fahl (IER)
The financing of the European energy transition presents significant challenges that must be addressed to achieve the Green Deal’s ambitious targets. A critical question is whether current funding mechanisms are sufficient to support this transition. This requires a thorough understanding of existing financial instruments, the role of public and private investment, the nuances public acceptance has in this situation and how industrial policy be conducted under these conditions. To date, there has been no comprehensive evaluation of the alignment of these financial tools with the transition’s long-term goals. Furthermore, as Europe progresses toward a carbon-neutral economy by 2050, it remains uncertain whether the existing financial frameworks can be scaled up or adjusted to meet future demands. This chapter takes a deep dive in addressing these questions about the challenges within the European Energy Transition and provides some ideas how to solve them.
3.2 Financing Gap and Burden Sharing
Authors: Nikolas Messerschmidt, Ulrich Fahl (IER) Two principal financing challenges emerge from the structural shifts associated with the energy transition. First, in two of the three scenarios outlined in the Impact Assessment (IA), projected investment needs for the energy transition increase progressively over the coming decades. Addressing this demand thus becomes an increasingly pressing issue. Revenue from mechanisms such as ETS 1 and ETS 2 will be insufficient to meet these financial requirements.66Polzin and Sanders (2020) “How to finance the transition to low-carbon energy in Europe?”For example, in Scenario S2 of the IA, the estimated annual investment need in the EU is €1,570 billion by the period 2041–2050 (at 2023 prices). However, the EU ETS generated only approximately €44 billion in 2023.67Europäische Kommission. (2023). Climate action progress report 2023 shows largest annual drop in emissions in decades. Abgerufen am 21.11.2024.Secondly, as will be discussed in Chapter 3.3, to ensure political support for these policies, it is necessary to reinvest these revenues outside the realm of green spending.
Key Message 3.1 (EU Level): Investment demands are expected to rise significantly, but current EU revenue streams from carbon pricing schemes remain inadequate to meet these increasing needs, resulting in a financing shortfall projected to grow over time. This shortfall is further exacerbated if revenues are allocated toward social support measures.
Within the EU, net-donor countries, such as Germany—particularly in relation to the Social Climate Fund—are increasingly required to shoulder the financial burden of the energy transition through domestic taxation. Nevertheless, revenue from energy-related taxes is projected to decrease. According to calculations using the IER-specific CGE Model NEWAGE, Germany faces a declining trend in tax revenue across all energy sources, with oil revenues experiencing the steepest decline. As illustrated in Figure 13 on the left, the reduction in tax income intensifies over time, with energy-related taxation on electricity, gas, and oil projected to yield only 33 % of the revenue observed in 2017 by the year 2050. Given that a technological shift within the next 20 years is more than likely the projection done within this work is a “best-case scenario”, the financial reality is likely graver than shown here as climate friendly energy carriers are normally taxed lower than their alternatives (Table 1).
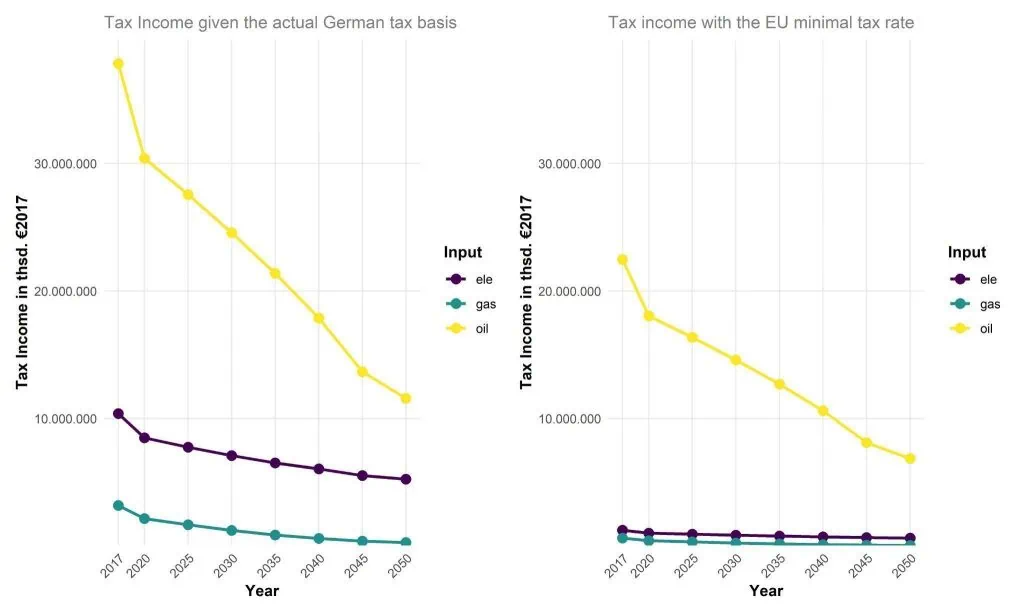
The EU mandates minimum tax rates for each energy carrier, all of which Germany currently exceeds, as shown in Table 1.68There is a relief on electricity tax that companies in the manufacturing industry or in agriculture and forestry (excluding electric mobility) of 5.13€/MWh until the end of 2023 and from 01.01.24 to 31.12.25 this relief amounts up to 20€/MWh.This highlights the critical role of political support for the energy transition, as meeting the financial requirements depends on sustained taxation levels. If political support in Germany were to diminish, leading to reduced taxation on energy consumption, it would not only weaken incentives for adopting alternative energy sources and reduce energy demand but would also substantially lower taxable income. Depending on the energy source, taxable income could decrease to between 12 % and 59 % of current levels, as illustrated on the right side of Figure 13. The current political debate in Germany thereby underlines the points made here as the debate on climate issues strongly declined and the overall consensus within the parties was that a reduction of energy taxation is necessary, opposed to the stance the political landscape took in the past. The current political debate in Germany reinforces these observations, as the prominence of climate issues has considerably diminished and a broad consensus now favors reducing energy taxation—a notable departure from previous political positions.
Key Message 3.2 (Country Level): Net-donor countries face an increasing obligation to close the financing gap using domestic resources, despite an anticipated decline in national-level revenue.
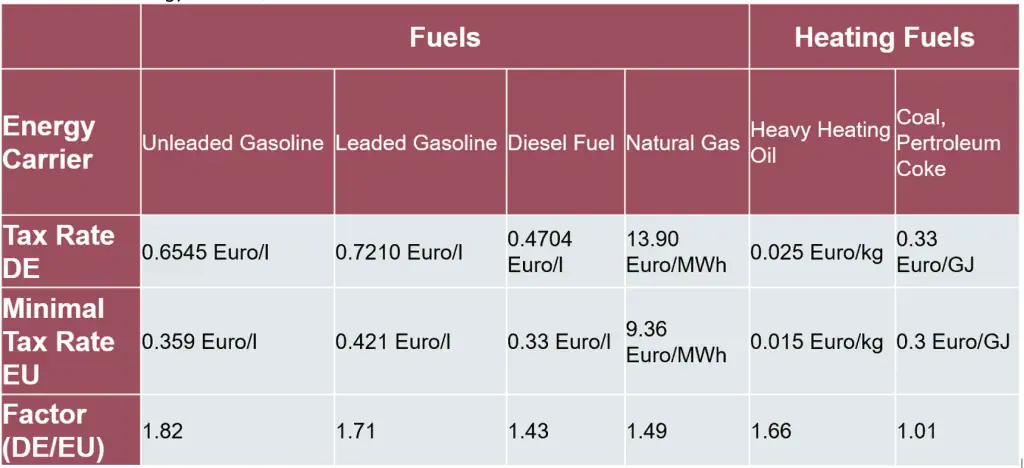
Pronounced between-country differences in the evolution
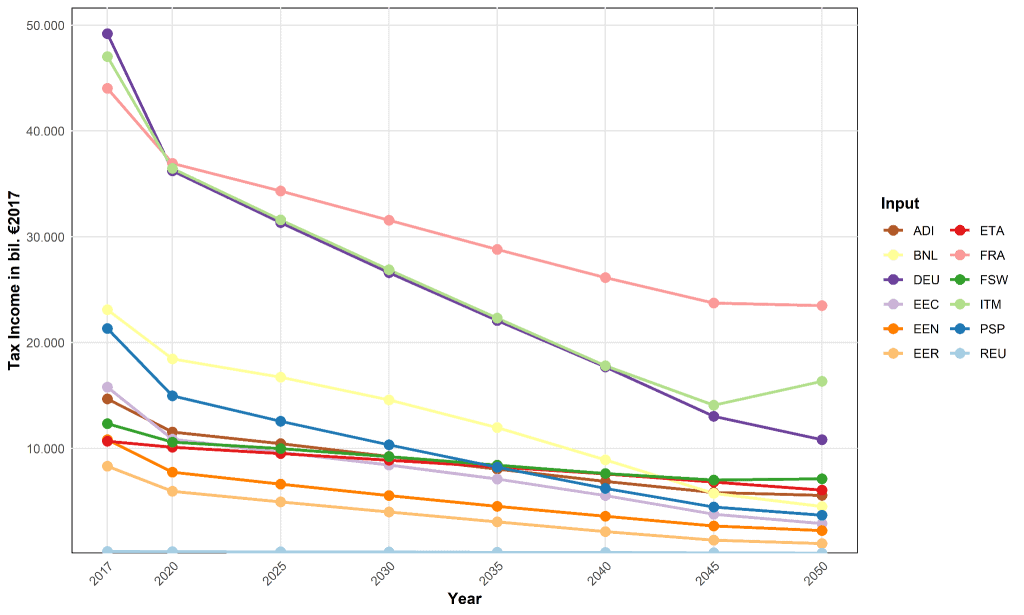
The same holds for other countries. As visible in Figure 14 especially larger countries like France, Germany or Italy are severely affected by this decline. The Italy & Malta (ITM) group however sees a slight increase between 2045-2050, which is due to an increase from energy intensive industries as well as private and governmental consumption.
It becomes evident that achieving a successful energy transition within the constraints of the current tax system will lead to a significant decline in state revenue. This analysis has illustrated why this poses a substantial challenge and why revenues from ETS 1 and ETS 2 are insufficient to offset these financial pressures. The threefold issue—rising investment needs, the necessity of allocating revenues to households to foster public acceptance, and declining income from energy taxation—will create mounting fiscal challenges for member states.
Key Message 3.3 (Country Level): The decline in energy taxation revenue is a challenge faced by every European country that successfully implements energy transition policies, albeit to varying degrees.
In countries such as Germany, where the tax system distinguishes between federal and state taxes, it is advisable to pursue long-term solutions early on. Short-term measures, such as increasing the value-added tax (VAT), may not translate effectively into federal revenue and could disproportionately impact low-income households.
This demonstrates that the European energy transition faces a significant revenue-sided challenge and highlights the need for public acceptance as a critical part of the solution. The following chapters will explore why achieving this acceptance is so complex and how it, along with a need to increase industrial competitiveness, further exacerbates the financing issue. The chapter will conclude with a proposed solution that could make a significant contribution to addressing the funding gap.
3.3 Just transition, public support, and distributional issues
Authors: Johannes Brehm (RWI), Simon Feindt (PIK), Henri Gruhl (RWI), Michael Pahle (PIK), contributing: Antonia Schwarz (PIK)
Ensuring a just transition is a critical aspect of financing climate action. As highlighted by Kurt Vandenberghe during the EUI Climate Week 2023, ‘The transition will be just, or it will not [happen] at all.’ This statement underlines the importance of ensuring that no one is left behind, which will require substantial funding for compensation and investment. However, it remains uncertain whether the necessary funding can be secured given tight budgets and emerging political distributive struggles. Moreover, even with adequate funding, the transition may still be perceived as unjust, especially if individuals lose their jobs and attribute these losses to the transition, or if the compensation and investment support are deemed inadequate.
While a significant majority of Europeans recognize climate change as a serious issue (93 %) and support the EU’s goal for climate neutrality by 2050 (88 %, Fig. 15, Panel a)69Special Eurobarometer SP538: Climate change, 2023.,there is a notable gap between this general support and the backing of more stringent measures required to achieve these goals. For instance, support diminishes for specific initiatives such as reforming the EU ETS (Fig. 15, Panel b)70Pahle et al., (2024). A Sobering Truth? Assessing the Impact of Revealing International Climate Cooperation Shortcomings on Policy Attitudes. mimeo.and declines further when it comes to incurring costs associated with such reforms, such as higher taxes (Fig. 15, Panel c).71Brehm, J., & Gruhl, H. (2024). Leveraging machine learning to understand opposition to environmental tax increases across countries and over time. Environmental Research Letters, 19(8), 084035.This gap between support for general climate action and policies varies significantly across countries and regions. The gap between support for climate action and willingness to incur the costs is most pronounced in Southern and Eastern Europe (maximum of 84 % in Slovakia), while it is smaller in the Nordics (minimum of 50 % in Finland).72The support gap can also be observed for sectoral climate policies, such as carbon pricing in the heating sector in Germany. See Knoche et al. (2024). Ariadne-Fokusreport Wärme und Wohnen – Zentrale Ergebnisse aus dem Ariadne Wärme- & Wohnen-Panel 2023. Kopernikus-Projekt Ariadne, Potsdam.
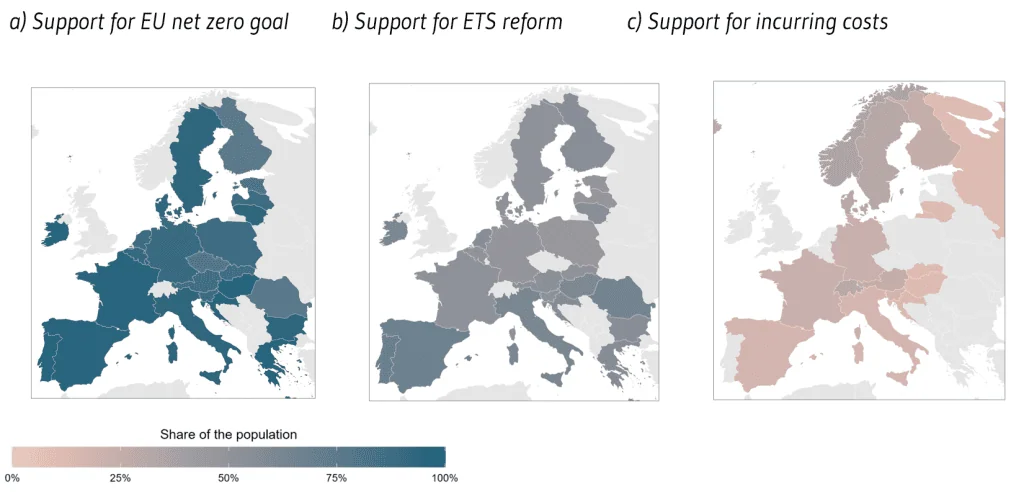
These findings highlight that public support for introducing new policies (EU ETS 2) or increasing the stringency of existing ones (EU ETS 1) may not be forthcoming, partly due to individual priorities like jobs and prices, which increasingly outweigh environmental goals in predicting support, but with important heterogeneity. Whereas Northern and Western European countries share similar predictors (having a brown job and worrying about jobs and prices), the picture is more heterogeneous in Eastern Europe.73Brehm, J., & Gruhl, H. (2024). Leveraging machine learning to understand opposition to environmental tax increases across countries and over time. Environmental Research Letters, 19(8), 084035.As people increasingly experience the tangible and intangible costs of climate policies, the politically stated rationale for greater stringency – the urgent need for climate action – loses its persuasive strength. Until competing concerns are addressed and climate action again becomes the public priority, further policy stringency will not readily be tolerated.
Key message 3.4: There is a notable gap between general support for ambitious climate action and support for the stringent measures required to achieve it. This support gap varies significantly across European countries.
Policymakers have generally assumed that ensuring fairness74The citizens’ deliberation within the Ariadne project highlight that public support for climate policy is shaped by its compliance with fairness concepts beyond the distributional justice — such as the polluter pays principle, regulatory equity, and intergenerational responsibility. Blum M., Treichel K., Kowarsch M. (2022): Sichten von Bürgerinnen und Bürgern auf vier Zukunftspfade der Verkehrswende — Ergebnisse der Ariadne-Bürgerkonferenz. Kopernikus-Projekt Ariadne, Potsdam.in the transition would automatically lead to high public support for climate policies and reduce the previously described support gap. Indeed, research indicates that revenue recycling might increase support for carbon pricing.75Sommer et al. (2022). Supporting carbon taxes: the role of fairness. Ecological Economics, 195, 107359.However, it remains unclear to what extent the support can be increased when the transition is made just. For example, equal-per-capita or targeted transfers have been found to only modestly impact public support76Kaestner, K., Pahle, M., Schwarz, A., Sommer, S., Stünzi, A., 2023. Experts’ conjectures, people’s statements and true preferences: The case of carbon price support. AEE Working Paper No 23-591., suggesting that closing the support gap is a challenging task.77Public acceptance of carbon pricing can be influenced by various factors beyond revenue use, including trust in government, information provision, transparency of the policy, participatory opportunities, and a lack of accessible green alternatives rather than opposition to the mechanism itself. Kalkuhl M et al. (2022): Optionen zur Verwendung der Einnahmen aus der CO2-Bepreisung Kopernikus-Projekt Ariadne, Potsdam.
Moreover, current policies may fail to ensure a just transition, potentially widening the support gap beyond the theoretical minimum. So far, the measures planned within the Social Climate Fund (SCF) have not garnered the expected broad support, partly because they do not sufficiently generate or ensure the social stability required. As a result, pres-sure points – defined as critical for securing public support and currently at risk of failure – are beginning to emerge. We identify four key pressure points related to EU climate policy: the size of the SCF, structural support measures, attitudes of voters towards the ETS, and democratic governance (Table 2).
Table 2: Emerging pressure points of EU climate policy
| Pressure point | Emergence | Problems | Ways forward |
| Size of the SCF | Volume not scaling up with carbon prices | Insufficient funds to ensure fairness and solidarity | Reopen SCF or price stability mechanisms |
| Structural support measures | Limited effectiveness and comprehensiveness of temporary and short-term measures | Targeting and adoption barriers, investment needs, interactions with national social welfare policies | Prioritization of regions over groups, align with green growth |
| Attitudes of voters towards the ETS | Unpopularity of carbon pricing even with revenue recycling and tailored information | Acceptance not only a function of (perceived) fairness and personal costs | highlight “inclusive prosperity” and “fair opportunities” (see Letta report) |
| Democratic governance | Mismatch between participation and design of the fund | Lack of inclusive stakeholder consultation and monitoring in the configuration of the SCF | Strengthen procedural legitimacy and monitored stakeholder engagement |
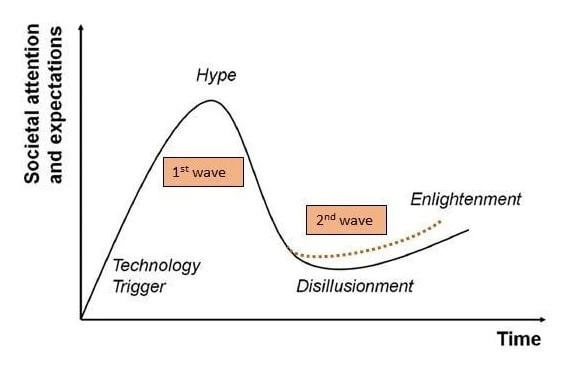
Addressing these pressure points is complex. Simplistic solutions, such as equal-per-capita transfers, fail to address the diverse range of issues associated with these pressure points. Idealistic solutions, such as the promise of leaving no one behind, however, may sound appealing but are unrealistic given the constraints policymakers face. These approaches might have been adequate during the introduction of the Green New Deal, when high expectations and levels of social attention were dominant (see Figure 16). Now, in a new societal phase – possibly a phase of disillusionment (see, e.g., the “green backlash”) –, modified approaches are needed. Future research and policy design thus would profit from a new approach (2nd wave) focusing on enabling conditions across the political, economic, and societal dimensions. Importantly, the 2nd wave should acknowledge the interactions with other policy areas and adopt a whole-of-society approach to positively affect the transition cycle.
An example is shifting the focus from the purely economic burden of climate policies to include co-benefits such as health, well-being, and climate resilience.79European Scientific Advisory Board on Climate Change (2024). Towards EU climate neutrality. Progress, policy gaps and opportunities.Policies and communication strategies should, for instance, emphasize improvements in air quality, with positive effects on health, educational outcomes, and labor productivity.80See for instance Brehm et al., 2022 (From LowEmission Zone to Academic Track: Environmental Policy Effects on Educational Achievement in Elementary School. Ruhr Economic Papers) and Brehm et al., 2024 (Low Depression Zones? The Effect of Driving Restrictions on Air Pollution and Mental Health. Ruhr Economic Papers).Aligning these efforts with regional green growth measures can address the above-identified region-specific concerns and offer tailored local narratives, thereby providing effective solutions for the pressure points and helping to close the support gap.
Key message 3.5: As emerging pressure points defy intended just transition, fostering public support requires a second wave of policy distributional analysis and design. This second wave needs to consider broader political, economic and societal (sociological) enabling conditions, and navigate the trade-off between fairness and progress.
3.4 Industry
Authors: Benjamin Görlach (Ecologic), Lena Kittel (IER), Darius Sultani (PIK), Leon Jonah Martini (Ecologic) While public support for the energy transition is one critical aspect, the transformation of Europe’s industrial base is another challenge. Although its leadership is increasingly contested, EU industry is still well positioned for the transformation to a climate-neutral economy. In particular, it has strengths in both domains of industrial transformation: building up key clean technologies and the value chains that support them – as well as transforming incumbent industries towards climate neutrality. As a region with a strong industrial base and both physical and knowledge infrastructure, EU industrial policy should seek to compete in both domains. Yet since other world regions are better positioned in terms of energy and labour costs or renewable resources, EU industrial policy needs to focus on those sectors, and those parts of value chains, where it can defend technological leadership and remain competitive. A more detailed explanation of which sectors those are and how leadership can be obtained is found in our accompanying paper about industry politics.81Martini, Leon, Benjamin Görlach, Lena Kittel, Darius Sultani and Nora Kögel (2024): Between climate action and competitiveness: towards a coherent industrial policy in the EU. Ecologic Institute, Berlin.
EU incumbents in basic material industries have accepted the need to transition their technological and asset base, and to some extent their business models, to remain competitive in a defossilised, climate-neutral economy. Increasingly, companies have developed strategies for the transformation, and (particularly in steel) have begun to put them into practice. The successful implementation of these strategies, however, depends on preconditions beyond the control of individual companies: this concerns the availability and costs of infrastructure (electricity, H2, carbon), the supply of renewable electricity and its cost, access to capital and an enabling permitting regime.
For key clean technologies, the EU’s strength lies in supplying engineering solutions and services. For the production of standardised, mid-tech mass products such as solar PV modules, however, the EU does not have favourable conditions, and the lead established in particular by Chinese producers in this area will be difficult if not impossible to overcome. Similarly, many locations outside the EU offer better deployment conditions for key clean technologies such as solar PV, electrolysers and direct air capture: in some countries, renewable resources such as sun, wind and water are more readily available, regulatory regimes and permitting is easier in others. As a result, the EU will rarely be the most attractive location. Yet the EU is still rather well-positioned for the manufacturing of wind turbine components, for electrolysers and potentially for industrial removal solutions.
Key Message 3.6: For some technologies and value chains, EU industry is well posi-tioned in the race for climate-neutral competitiveness – in others the EU risks falling behind.
The EU has a large suite of funding instruments. However, many of these are relatively small, distributing only several million Euros every year. The main EU funds for low-emission innovation and industry transition (Innovation Fund, Horizon Europe and the European Innovation Council) add up to about €10 billion in 2023. While substantial, this pales in comparison to annual investment needs. According to the EU Commission (2024b), reaching EU climate targets requires annual investments of about €1,241 billion until 2030. While the majority of this will be private investments, still the EIB (2021a) estimates that about 25 % of investments will be public, whereas Pisani-Ferry and Mahfouz (2023) or Baccianti (2022) estimate an even larger share of 50 % public investments.
In addition, existing EU funds are difficult to access and managed in a risk-averse way. Pinkus et al. (2024) note two shortcomings with EU programmes: a bias to avoid failures and thus against risk-taking, and the fact that Commission services, who manage the programmes, lack the mandate and independence to terminate unsuccessful projects and adapt them flexibly. Moreover, experience with the Innovation Fund has shown that startups and SMEs struggle to access it, because of the complex application process. Instead, most grants were awarded to large companies.
EU level funding mostly focuses on the early stages in the innovation chain (research and development), where the EU performs relatively well in comparison to major competitors. Figure 17 shows total public R&D spending on energy technologies in the EU, US, Japan, and South Korea. Per unit of GDP, EU public RD&D spending is higher than in the US and South Korea and as high as in Japan.
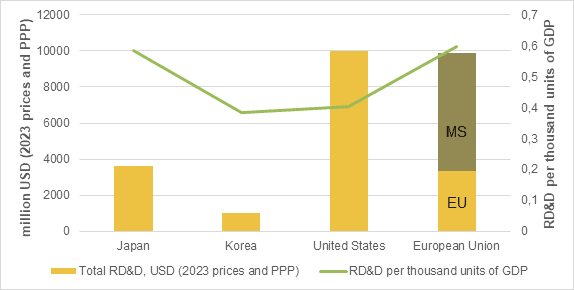
However, there is a lack of (funding) instruments addressing first-mover-disadvantages and the capital market imperfections that hamper scale-up. Instruments in the EU are focused on early-stage innovation support. The biggest innovation programme is Horizon Europe, which focuses on research and development. For demonstration, scale-up and commercialization, the options are much more limited. While the Innovation Fund provides support for the demonstration of low-carbon innovations, the volumes are insufficient and difficult to access, especially for scale-ups. This lack of support for the scale-up and commercialisation of innovation is a major weakness of the EU’s industrial policy mix (see also Humphreys, 2023).
Next to lacking scale-up finance, the EU has little deployment support and instruments that incentivise investments in cleantech manufacturing. EU innovation support and other financial support tends to be project-based and focused on capital expenditures on the supply side. In the context of cleantech and low-carbon industry competition, this puts EU industry and the policy framework at a comparative disadvantage to major competitors, such as China or the US, who directly support their industries’ operational expenditure, including through the US IRA (Deloitte, 2023b Jansen et al., 2023). While some MS provide deployment and OPEX (e.g. in the form of lower electricity tariffs for industry or dynamic subsidies such as Carbon Contracts for Difference), there is little OPEX and deployment support at EU level.
Key Message 3.7: The EU dedicates only moderate financial volumes to the promotion of key clean technologies, and to support industry transition – far below the invest-ment needs. And while the EU performs comparatively well in R&D spending, the big-gest gaps are in scale-up and deployment support.
There is little EU coordinated industrial policy spending: only Horizon Europe and the Innovation Fund are fully programmed at EU level. Instead, most of the programming, allocation and sometimes financing of support for green industrial investment takes place in the Member States, while EU policies merely set general conditions and guidelines. This tendency was reinforced through the EU’s response to the IRA[BG1] [LJM2]: while the EU-coordinated response (NZIA, STEP) had limited effect, the main response (also in terms of financial volume) was to extend the transitional rules on state aid that applied during the pandemic and energy price crisis, allowing member states to increase their support to companies.
Spending a greater share of funding via the EU level can increase efficiency, as financial resources benefit the most competitive projects across the EU, and not just those located in the member states that can afford it. The EU Hydrogen Bank exemplifies this point very well: it provides price subsidies to renewable hydrogen production through an EU-wide auction, selecting those projects that require the lowest subsidy. In addition, member states can make use of the EHB’s services through the auction-as-a-service scheme, where member states provide additional funding that is then auctioned to the next-best projects from the member state that provides the funding. As McWilliams and Kneebone (2024) have documented, Germany was the only member state to use this scheme. An additional €350 million were thus provided to German bidders, resulting in the support of 0.09 GW of production. If the €350 million had been awarded through the EU-wide auction, this would have supported 0.7 GW – eight times more. In addition, EU-level programming means that investments can leverage the potential of the EU single market to scale up solutions, for instance through EU-wide lead markets for climate-friendly technologies and outputs.
If industrial policy is mostly left to member states, it will be used primarily by those who can afford it (E3G et al., 2024; Humphreys, 2023; Jansen et al., 2023). This brings the risk of distorting competition in the single market, as some member states can subsidies domestic producers, whereas others cannot. Also, such economic fragmentation may ultimately result in political fragmentation, as poorer member states are left behind and revolt against the use of state aid. Such pushback is already visible.
Key Message 3.8: Most European spending to support green industrial investment hap-pens in the Member States. Programming and allocating financial instruments at EU level can bring large efficiency gains, especially if funding is allocated in a competitive process. But it can also reduce the risk of economic and political fragmentation.
Programming industrial policies at EU level has benefits – in terms of efficiency and scale. But to reap these gains also requires that funding needs to be made available at EU level, with no guarantee to which locations funds will flow. But to convince private investors and banks, they need to be convinced that sufficient public co-funding will be available, with a credible commitment to provide such funding it as long as needed, and at the scale needed. In this regard, the IRA stands out as a policy that has created this expectation – whereas the EU’s initial answer, the Strategic Technologies for Europe Platform, illustrates the risk of high ambitions combined with inadequate funding.
It is the subject of much heated debate whether this requires own resources for the EU Commission, e.g. a greater share of carbon pricing revenues, access to other, new sources of finance, or even common borrowing. To prevent this aspect from derailing the broader discussion on EU-level industrial policy, it is important to not put the horse before the cart: the source of funding is secondary – the main issue, rather, is that sufficient funding is available in a reliable and predictable way.
Key Message 3.9: EU-level programming of industrial policy will require reliable funding at EU level – own resources or common borrowing can be part of the answer.
3.5 The role of public finance in addressing low-carbon investment needs
Authors: Alyssa Gunnemann, Tobias Schmidt, Bjarne Steffen (ETH), contributing: Michael Pahle (PIK)
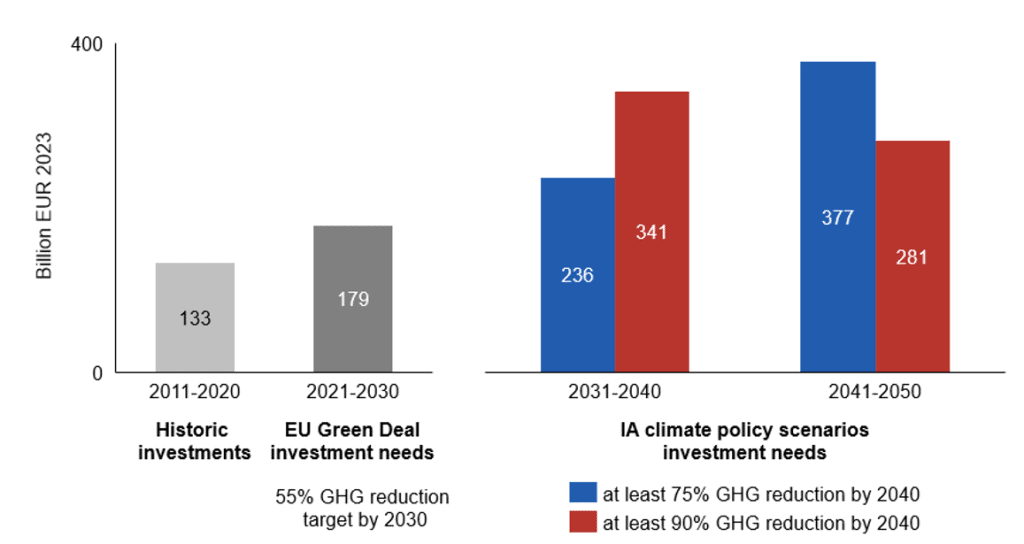
Transitioning to a low-carbon economy demands substantial investments in clean energy technologies. While many of these investments yield subsequent fuel cost savings that make them economically viable, the need for upfront financing can pose significant chal-lenges. Achieving the 90-95 % reduction in greenhouse gas (GHG) emissions by 2040, as recommended by the European Scientific Advisory Board on Climate Change, will require annual energy supply investments of 341 billion EUR2023 in 2031-2040 and 281 billion EUR2023 in 2041-2050 (Figure 18).
To meet these targets, future investments must greatly exceed past levels, rising from 1 % of GDP2023 (2011-2030) to 2 % (2031-2050). Though capital is available, mobilizing it remains crucial.83Egli, F., Steffen, B. and Schmidt, T.S., 2022. Financing the energy transition: four insights and avenues for future research. Environmental Research Letters, 17(5), 051003.; Polzin, F. and Sanders, M., 2020. How to finance the transition to low-carbon energy in Europe?. Energy Policy, 147, p.111863.The immaturity of certain technologies and the urgency of the transition amplify market, system, and transition failures, underscoring the need for policy intervention. Market-based mechanisms, such as carbon pricing, are core components of Europe’s climate policy, but addressing additional market failures may require supplementary measures like direct public finance investments, especially for emerging technologies84Waidelich, J., Krug, S., & Steffen, B. (2024): Mobilizing Credit for Clean Energy: De-risking and Public Loan Provision Under Learning Spillovers, CESifo Working Paper 11118.Yet fiscal constraints, as many countries approach debt sustainability limits, limit the availability of public finance, making it vital to identify which public finance investment options and governance levels offer the greatest potential for driving transformative change. Public finance operates on a continuum between private and public spheres, shaped by financing type and the institution responsible. The three main financing types include equity (ownership shares with returns), debt (loans with interest), and grants (non-repayable funds). Institutions vary as well, from public offices driven by administrative logic to hybrid models such as state-owned enterprises (SOEs) and state investment banks (SIBs), which blend public objectives with market functions.85Meelen, T. & Sluijs, J. (2023): Public Ownership for Sustainability Transitions: Empirical Insights for EU Policymakers; Steffen, B., Karplus, V.J., & Schmidt, T.S. (2023): State Ownership and Technology Adoption: The Case of Electric Utilities and Renewable Energy. Research Policy 51 6; Geddes, A., Schmidt, T.S., & Steffen, B. (2018): The Multiple Roles of State Investment Banks in Low-Carbon Energy Finance: An Analysis of Australia, the UK and Germany. Energy Policy, 115, 158-170; Waidelich, J. & Steffen, B. (2024): Renewable Energy Financing by State Investment Banks: Evidence from OECD Countries. Energy Economics 132.These two factors result in five public finance options as highlighted in (Table 3).
Table 3: Public finance options with examples for the European Union and Germany on different levels of governance (Source: own illustration)
| Description | European Union | National | Subnational | ||
| Equity | Public office | Public offices and SOEs both manage equity with public funding; public offices are fully funded, while SOEs have majority state ownership. They differ in legal form, employment, commercial interests, and governance. | not applicable | Bundesanstalt für Immobilienaufgaben (Real estate mgmt. and utilization) | Landesbetrieb für Straßenbau NRW (Federal state admin. and operation of roads) |
| State-owned enterprises (SOE) | not applicable | Deutsche Bahn AG (Railway company) | Stadtwerke Dresden GmbH (Municipal utilities company) | ||
| Debt | Public office | Public offices and SIBs both issue (subsidized) loans for societal goals with a domestic focus, but SIBs operate independently in day-to-day matters. | not applicable | Mikrokreditfond Deutschland (Microcredit lending) | less common |
| State investment bank (SIB) | European Investment Bank | Kreditanstalt für Wiederaufbau (Investment and development bank) | LandesBank-BadenWürttemberg (Federal state investment bank) | ||
| Grants | Public office | Public offices administer grants, aligned with societal objectives. | Innovation Fund (European fund for deployment of technologies) | Projektträger Jülich (Intermediary for research and innovation funding programs) | Landesenergieagentur Hessen (Federal state central contact and coordination office for energy projects) |
While past research has often examined public finance options separately or within specific contexts, a comprehensive assessment is needed to evaluate trade-offs with private finance. Such an analysis should explore how public finance can advance societal goals, facilitate technology deployment, foster directed technical change, and mobilize private capital. This assessment should consider criteria ranging from efficiency to fiscal impacts, recognizing that different types of public finance have unique potentials across sectors and governance levels.
From a European perspective, public finance operates across multiple governance levels: European Union, national, and subnational.86Hooghe, L.& Marks, G. (2003) „Unraveling the Central State, but How? Types of Multi-level Governance”. Cambridge University Press.Each level has access to various financing options, with the EU level primarily employing loans through the European Investment Bank and grants through public offices. The optimal combination of public finance options and governance levels may vary depending on investment challenges and sector characteristics. This is particularly relevant as emerging clean energy technologies not only require substantial asset finance87Schmidt, T.S., 2014. Low-carbon investment risks and de-risking. Nature Climate Change, 4(4), pp.237-239; Steffen, B., 2018. The importance of project finance for renewable energy projects. Energy Economics, 69, pp.280-294.but also face heightened initial investment risks88Egli, F., Steffen, B. and Schmidt, T.S., 2018. A dynamic analysis of financing conditions for renewable energy technologies. Nature Energy, 3(12), pp.1084-1092., and demand greater investment volumes for sector-wide transformation.89Klaaßen, L. and Steffen, B., 2023. Meta-analysis on necessary investment shifts to reach net zero pathways in Europe. Nature Climate Change, 13(1), pp.58-66.
Key message 3.10: Public finance offers multiple distinct options to address low-carbon investment needs, with their impact varying by financing type and implementing organization. Further research is needed to explore the role of different governance levels.
4. Conclusions
Authors: Benjamin Görlach (Ecologic), Ulrich Fahl (IER), Michael Pahle (PIK)
1) The Revised Architecture of EU Climate and Energy Policies
With the adoption of the Fit for 55-package, the EU has installed a fairly comprehensive set of policies to achieve its energy and climate targets for 2030. The revised policy mix includes technology neutral approaches to reduce GHG emissions, above all the existing EU ETS and the new ETS 2. It obliges Member States to achieve GHG emissions reduction targets under the ESR, and further extends technology specific rule-based approaches, such as tighter vehicle efficiency standards or regulations on the energy performance of buildings. While the ambition levels of the targets has been increased, the EU energy and climate policy has also become more comprehensive: it now contains elements to mitigate some of the negative side-effects of climate policy, particularly regarding distributional effects (social climate fund), regional imbalances (just transition fund) and competitiveness (CBAM, innovation fund).
Emissions Trading remains the keystone of the EU climate policy architecture, and one of the strongest compliance mechanisms – with the ETS 2, about 80 % of EU GHG will be under a firm cap. Both the EU ETS and the ETS 2 establish an extremely ambitious emission reduction trajectory on the way to climate neutrality, with annual reductions of 4-5 %. Adhering to this trajectory through emissions trading alone would imply very high carbon prices, and a firm and credible commitment to sustain these carbon prices under all circumstances. Given the political risks involved, it is appropriate to include complimentary policies in the mix that work in the same direction as emissions trading, and complement it by driving the transformation of energy and mobility systems. Yet if these complimentary policies are questioned for lack of political acceptance (vehicle emission standards / phase-out of fossil combustion engines), or for lack of financial resources (investment subsidies), it puts more pressure on the carbon price as the “policy of last resort”.
2) Enhance Consistency and Reduce Fragmentation of Energy and Climate Policies
EU energy and climate policy has evolved historically, rather than having been designed around a common approach and coherent set of principles. Hence, it reflects several (competing) approaches. Those can result in overlaps and gaps in the EU policy, which again may lead to mixed signals or distortions for the market. A case in point is the overlap between the ETS 2 and the ESR – but also the fact that the EU operates separate ETS in parallel, covering emitters in different sectors with different prices. Such inconsistencies reduce the overall efficiency of the system and create several risks: first, increasing tension in the architecture, as separate systems with (implicit or explicit) carbon prices entail that emitters in different sectors face different abatement costs, and are thus burdened in different ways. Second, fragmentation bears the risk of distortion, especially as uncertainty rises along with ambition: as emitters are faced to take ever more ambitious steps to reduce emissions, there are fewer precedents and less knowledge about the available abatement measures, their effectiveness and their cost. Third, the complex architecture, combined with information asymmetries and limited administrative capacities, creates a risk of policy failure. Instead of maintaining (or even increasing) fragmentation, EU climate policy should therefore aim for gradual convergence of compliance mechanisms, guided by a long-term vision of economy-wide carbon pricing. In approaching this goal, gradual convergence measures such as exchange rates can release architectural tension in a controlled way. Considering the current political situation, however, it seems rather unlikely that convergence will be achieved.
The risks and costs of such inconsistencies are exemplified by the overlap between the future ETS 2 and the ESR. In terms of emissions covered, the ETS 2 emissions are entirely contained in the scope of the ESR. In addition, both instruments foresee flexibility through trading of emissions allowances across national borders – between emitters in the case of the ETS 2, and between national governments in the case of the ESR. Yet, trading of ESR allowances has rarely been used in the past. If this were to remain the case, it would render the ETS 2 ineffective, with significant efficiency losses and economic cost. Put differently, if there was fully flexible trading also under the ESR, the ETS 2 would yield sizeable efficiency gains. Those could save 16-22 % of policy costs, and as a result relax the upward pressure on the ETS2 carbon price. By contrast, the efficiency loss from maintaining two separate emissions trading systems is more limited: compared to the theoretical ideal of a single carbon prices across all sectors, an effective ETS 2 would still achieve 81-98 % of the possible efficiency gains – in other words, the separation of the systems means that 2-19 % of efficiency gains are foregone.
3) Make Emissions Trading fit for the Endgame
As the central compliance instruments, it is crucial that the EU ETS and ETS 2 send a stable and credible price signal that allows the actors covered to anticipate future conditions – all the more so as the ETSs enter a period of rapidly declining caps. The Market Stability Reserve (MSR) serves as the central stability mechanism in both ETSs, intended to address shocks and uncertainties effectively. Yet depending on how far market-actors look into the future when taking decisions (i.e. the discount rate they apply), their banking and hedging behaviour in anticipation of future scarcity will differ. Such difference makes it challenging to determine an adequate MSR “hedging corridor”. The hedging corridor calibration issue could potentially be addressed by making the MSR thresholds for intake and outtake dynamic and using more refined indicators. However, in its current setup, the MSR may rather reinforce anticipated scarcity. Replacing it with a more suitable mechanism seems advisable.
4) Develop an EU-wide Hydrogen Market and Integrate it with the EU Energy Market
Reducing GHG emissions below 85-92 % below 1990 levels by 2040 requires the accelerated deployment of wind and solar power, and electrification across most end uses in mobility, buildings and industry. For those uses and applications where electrification is not feasible economically, technologically or politically – such as steel manufacturing, parts of chemical industry or aviation – hydrogen or hydrogen-derived synthetic fuels offer possible solutions. Yet, the EU still lacks a comprehensive strategy for using low-carbon hydrogen as a transitional solution to support the market ramp-up of renewable hydrogen. While hydrogen production is covered by the EU ETS, the price signal is not sufficient to overcome the cost disparity between renewable / low carbon hydrogen and natural gas. A key reason is that a significant share of emissions from conventional hydrogen are methane emissions during the upstream phase, i.e. the production and transport of natural gas. Methane emissions, however, are not priced under the EU ETS, in addition they mostly occur outside the EU. Extending the EU ETS (and CBAM) to cover such upstream emissions would more accurately internalize the climate impacts, leading to a fairer comparison between low carbon and renewable hydrogen.
Developing an integrated market for hydrogen across Europe offers significant efficiency gains but has distributional effects: above all, electricity prices in countries with high renewable potential would be higher than in the absence of hydrogen trading. Yet limited availability of key inputs and high cost mean that these options will remain limited and should be used strategically. One recommendation from the research is therefore to address distributional impacts of hydrogen markets and integrate upstream emissions in the ETS to support low-carbon energy transitions.
5) Acknowledge the Spatial Dimension of EU Energy Policy
With the 2023 amendment of the Renewable Energy Directive (RED III), the Directive no longer only seeks to promote renewable energy projects, but rather establishes a comprehensive framework including aspects of spatial planning and administrative permitting processes. Key features include the designation of “acceleration areas” to prioritize land use for renewable energy, but also a more integrated approach to spatial planning, including the creation of “multifunctional areas,” to avoid the overplanning of land and the associated intensification of pressure on this finite resource.
This marks a significant development, as the EU has, for the first time, established a permanent framework dedicated to the planning and approval of renewable energy projects. To better enact this provision, Member States should enact holistic land-use policies that prioritize multifunctional land-use planning. In this way, they can better address the intensifying competition for scarce land, between the needs for renewable energy infrastructure and other uses.
6) Financing the Transformation to Climate Neutrality
The EU faces a growing financing challenge: the transformation to climate neutrality requires public and private investments across all parts of the economy. Many of these investments – for instance for new energy and transport infrastructure, or for industry decarbonization – are capital-intensive and front-loaded: while they are eventually expected to pay for themselves in the form of lower operating expenditure, they require a (substantial) initial investment. The revenue streams available from the EU’s major financing instruments are already insufficient to deliver (the public share of) the necessary investment. This gap is expected to widen over time. The following factors exacerbate the situation:
- At the country level, net contributors to the EU budget increasingly bear the responsibility to bridge the EU financing gap from domestic resources. Notable pressure comes from the decreasing revenues from energy taxation — a universal challenge for European countries that successfully implement energy transition policies, though the extent of the impact varies among Member States.
- As the costs of the transition rise, so does the need for social support measures in the form of compensation or assistance to vulnerable households. Public support for ambitious climate goals remains high across Europe, but the general and abstract approval of climate goals does not translate into support for concrete measures of the stringency necessary to achieve these objectives. To address this discrepancy, a second wave of EU policies is needed that address socio-economic pressure points based on distributional analysis.
- To secure the position of European industries in the global race for climate-neutral competitiveness, more public support is needed – not the least to match the ample support available to manufacturers elsewhere. While EU manufacturers are still well positioned for some technologies and value chains, the EU is falling behind for others. One reason is financial resources: the EU dedicates only moderate financial volumes to promoting key clean technologies and supporting industrial transitions, far below the scale required to meet investment needs. Despite a relatively strong performance in research and development, significant gaps exist in the scale-up and deployment phases, crucial for translating innovation into widespread impact.
Public finance provides a range of tools to address low-carbon investment needs, yet the effectiveness of these tools varies based on the type of financing and the implementation. In several instances, the available funds could be spent more efficiently if they were centralized at the EU level: For instance, programming and allocating financial instruments for green industrial investment at EU level could yield substantial efficiency gains, particularly if funding is distributed through competitive processes. This approach not only enhances resource allocation but also mitigates risks of economic and political fragmentation. Achieving these benefits will require reliable and sustained funding at the EU level, potentially through mechanisms like own resources or common borrowing.
Tightening public budgets entail the need to focus, use resources efficiently, rely on market-based elements and competitive processes where possible, and to reduce distortions and fragmentation where they prevent efficient outcomes. In many instances, EU solutions can be more efficient than national arrangements, by expanding the scope and leveraging the potential of the single market.
Authors


Dr. Ulrich Fahl
Universität Stuttgart - Institut für Energiewirtschaft und Rationelle Energieanwendung


Nikolas Messerschmidt
Universität Stuttgart – Institut für Energiewirtschaft und Rationelle Energieanwendung


Dimitrios Tsoutsoulopoulos
Universität Stuttgart – Institut für Energiewirtschaft und Rationelle Energieanwendung