
Table of Contents
Summary
Climate change is not slowing down. In 2024, two significant records were set: for the first time, the global mean temperature exceeded +1.5 °C above pre-industrial levels (Copernicus Climate Change Service, 2024), and global CO2 emissions reached a new peak (Global Carbon Project, 2024).
Germany’s energy transition is making clear headway. By 2024, Germany’s greenhouse gas emissions (GHG emissions) fell by almost 50% compared to 1990 (Umweltbundesamt 20241https://www.umweltbundesamt.de/sites/default/files/medien/11867/dokumente/emissionsdaten_2024_-_pressehintergrundinformationen.pdf). In addition, in 2024, more than 60% of net public electricity generation came from renewable sources (Burger 2025). This is mainly due to the expansion of solar energy that has accelerated since 2022 and the ongoing efforts to phase out coal-fired power generation.
Rapid electrification and decarbonisation of building heating, transport and industry are key. The German targets for emissions reduction by 2030 and climate neutrality by 2045 necessitate a deep electrification of building heating and road transport, as well as a transition to almost CO2-neutral production in virtually all industrial production processes.
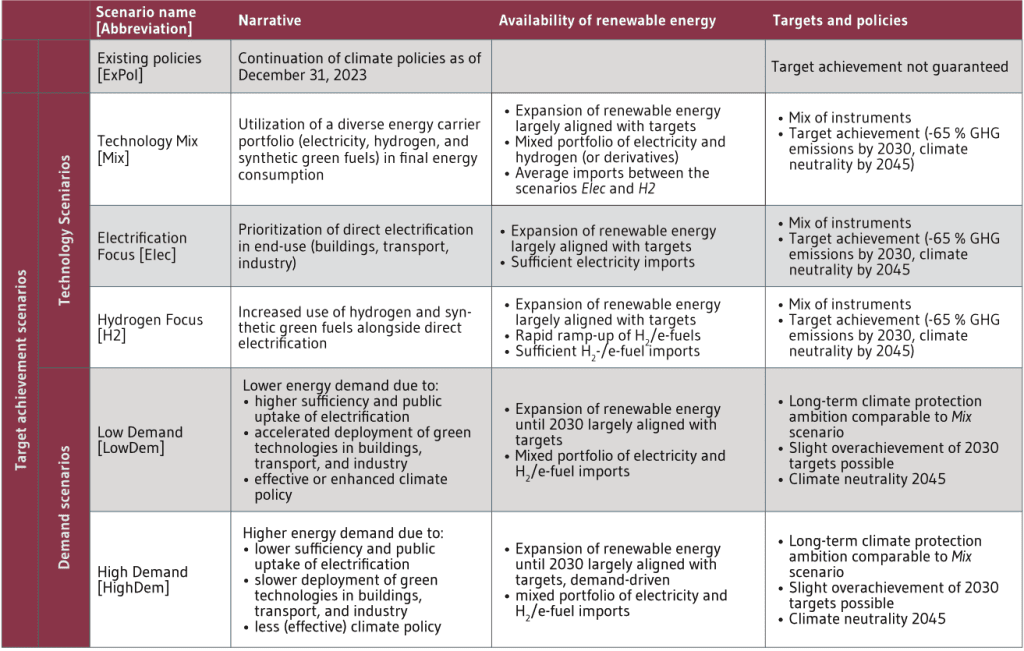
The Ariadne Scenario Report explores alternative options for the German energy transition. To this end, five scenarios are modeled towards achieving the 2030 emission reduction and 2045 climate neutrality targets: Three scenarios with different technology orientations – Electrification Focus (Elec), Hydrogen Focus (H2), Technology Mix (Mix) – explore the plausible range between strategies prioritizing direct electrification and strategies with more emphasis on indirect electrification (the use of electrolytic hydrogen and derivatives). Two additional scenarios with varying demand – Low Demand (LowDem) and High demand (HighDem) – show the effects of an accelerated or sluggish transformation of the buildings, industry and transport end-use sectors. A sixth scenario, Existing Policies (ExPol), which only considers those climate policies that have already been implemented, falls short of reaching the target of climate neutrality in 2045. All scenarios are calculated in a model comparison with five energy system and sector models.
Z.1 Transformation of the energy system
In all climate neutrality scenarios, electricity generation is largely decarbonized by 2030 and almost completely decarbonised by 2035 (Figure Z.1). This requires the massive expansion of renewable electricity generation, electricity grids and flexibility options (storage, electrolysis and intelligent load management by electric vehicles, heat pumps and industry).
The share of wind and solar power in the electricity mix is projected to rise to 84–91% in 2035 (Technology Mix scenario). Overall, this corresponds to an approximately threefold increase in wind and solar electricity generation by 2030 compared to 2020. Wind energy, in particular, plays an important role due to its favourable seasonal generation profile.
Greater flexibility in the electricity system is a key requirement for more renewable electricity generation. A large part of the flexibility (especially over periods of days to weeks) is provided by electricity storage (mainly stationary battery storage, but also pumped-storage power plants), the flexible charging of battery electric vehicles and electricity trading with neighbouring European countries. By 2045, the discharge capacity of electricity storage systems is projected to reach 50 GW, with a total storage capacity of 435 GWh. Flexible demand from heat pumps and in industry can also make a small contribution to flexible demand. In the long term, industrial demand-side flexibility over 5–15 minute intervals could amount to 5–9 GW (SynErgie 2024). Backup power plants with a combined capacity of 90 GW in 2045 are expected to contribute around 5% of total electricity generation, making a small but important contribution to system flexibility, particularly by balancing seasonal fluctuations in power supply.
Regional electricity pricing enables more efficient grid planning and helps lowering yearly average electricity costs for end consumers all over Germany. Splitting Germany into multiple regional electricity price zones allows for efficient, integrated grid planning. As a result, average end-user electricity prices could decrease by approximately 7.5 EUR/MWh by 2045. At the same time, a price difference of around 10 EUR/MWh (yearly average) is expected to emerge between southern and northern Germany. In the North, electricity prices tend to be lower due to high shares of wind power generation.
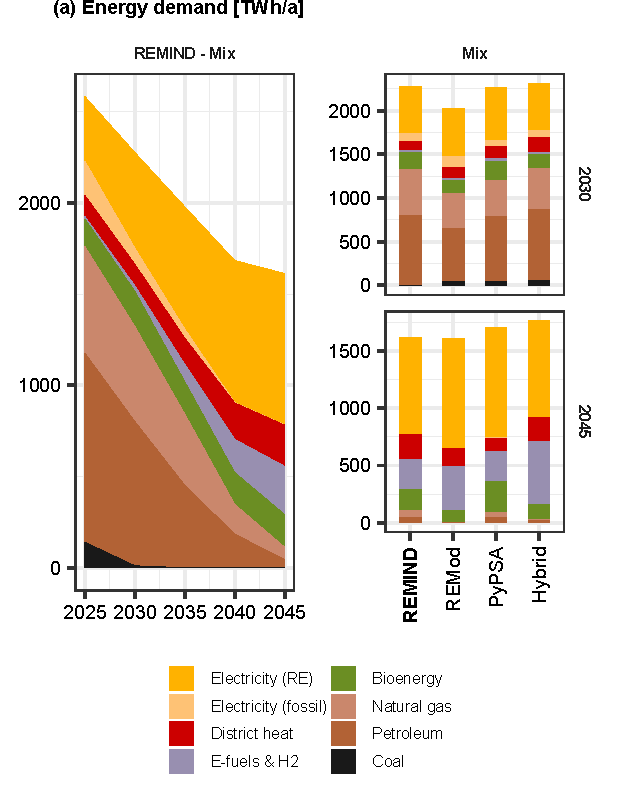
Direct electrification plays a central role for reaching climate neutrality in building heating and road transport as well as substantial parts of industry (Figure Z.1a). Direct electrification – especially via heat pumps and battery electric mobility – is characterized by high energy conversion efficiency and low climate change mitigation costs. Combined with energy-efficient building renovations and a material- and resource-efficient circular economy in industry, this leads to a 32–38% reduction in total final energy demand by 2045 compared to 2023. Overall, the share of electricity in total final energy consumption (including industrial feedstock use and international aviation and shipping) increases from 17% in 2023 to 47–59% by 2045.
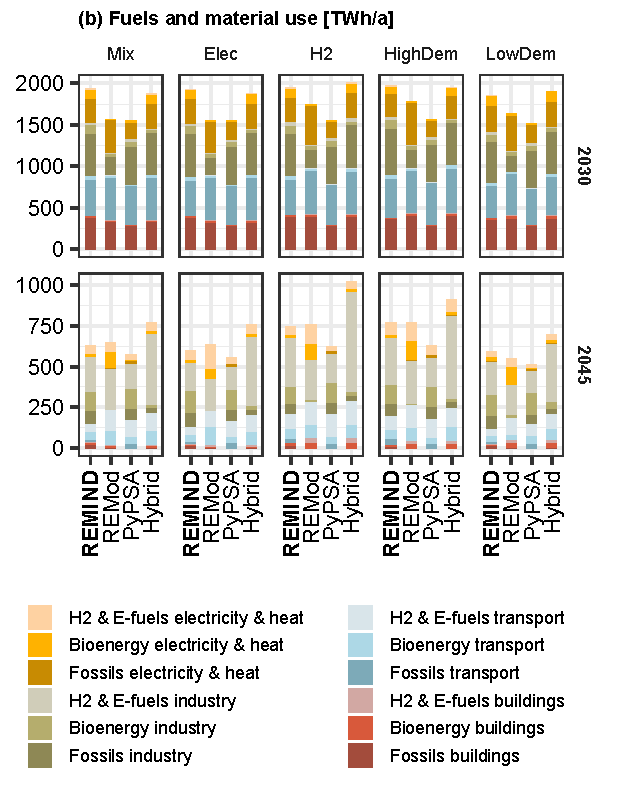
A key bottleneck on the path to climate neutrality is the supply of and demand for renewable non-electric fuels and feedstocks (“green molecules”). In the climate neutrality scenarios demand for fuels and energy use falls to 515–1,023 TWh in 2045, driven primarily by the needs of the basic materials industry, aviation and maritime transport and – to a lesser extent – fuels for backup power generation (Figure Z.1b).
Biomass will remain available only in limited quantities, reinforcing the continued need for widespread direct electrification. To avoid emissions in industry, aviation and maritime transport, bioenergy can contribute around 200 TWh – but it must be supplemented with hydrogen and e-fuels to meet the overall demand for green molecules (Figure Z.1b).
Hydrogen and e-fuels remain scarce and expensive. They are primarily reserved for energy needs that cannot be directly electrified – such as certain industrial processes, aviation, maritime transport and for backup power generation. According to model results, hydrogen production costs are projected to be 156 EUR/MWh in 2030 and 110 EUR/MWh in 2045.
In 2045, Germany will depend on imports of 60–250 TWh of hydrogen and 100–130 TWh of e-fuels, according to model results from the Technology Mix scenario. For context, Germany imported an average of 943 TWh of natural gas and 1,041 TWh of crude oil annually between 2010 and 2019. Overall, 34–68% of hydrogen is expected to be produced domestically, with the remainder imported. In contrast, e-fuels are predominantly imported.
The development of hydrogen and CO2 infrastructure, as well as the expansion of district heating networks, must begin early. Hydrogen and CO2 infrastructure are critical for achieving climate neutrality in industry, while district heating systems are key to supplying climate-neutral heat in densely populated urban areas. Depending on the model and scenario, hydrogen demand varies considerably, leading to different estimates of the required size of a core hydrogen network. According to some model results, the scope of the core network approved by the German Federal Network Agency in October 2024 (comprising 9,040 km of pipelines and EUR 18.9 billion in investment) lies at the upper end of what is expected to be needed for long-distance hydrogen transport in Germany by 2045. This outcome depends heavily on the future role of hydrogen in backup power generation, the extent to which hydrogen or alternative climate mitigation options are used in the production of plastics, and whether the hydrogen-intensive steps in important value chains (e.g. steel, ammonia) are relocated to countries with more abundant and cost-effective renewable electricity (Verpoort et al. 2024b).
Z.2 Investments in the energy transition
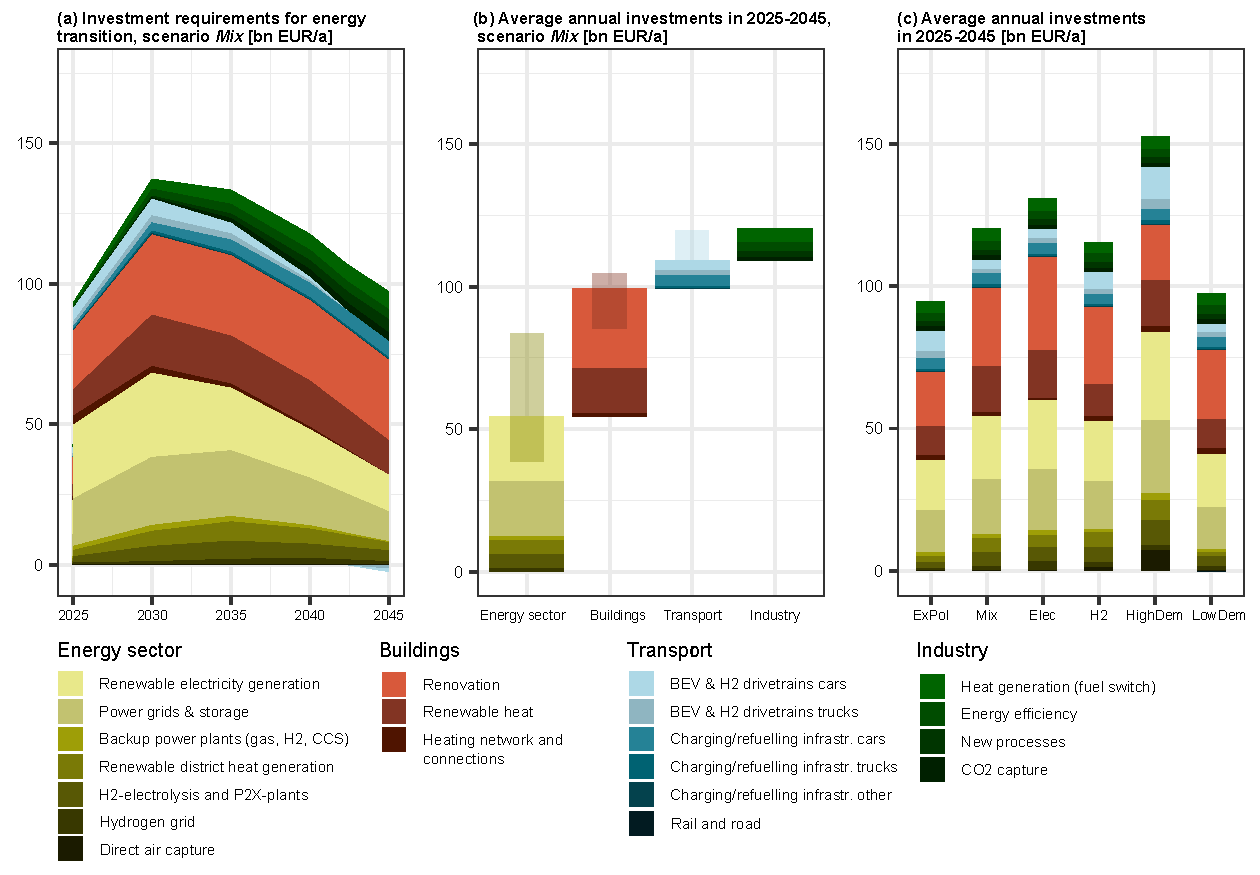
The climate-neutral transformation of the energy system induces investments of approximately EUR 116–131 billion per year (around 3.5% of GDP in 2024) (Figure Z.2c). This is shown by the model results for the Technology Mix, Electrification Focus and Hydrogen Focus scenarios, all of which achieve climate neutrality by 2045. The investments considered include those in climate-friendly technologies for building heating, industry and the energy sector, as well as investments in the transition to electric mobility, those enabling the energy transition (e.g. electricity grids, charging infrastructure) and other investments aimed at emission reductions. A significant portion of these investments (EUR 95 billion per year) will already be driven by measures that have been decided to date (Existing Policies scenario).
At EUR 40–50 billion per year, the heating transition in the building sector accounts for a significant portion of the investment needs for the energy transition (Figure Z.2c, technology scenarios).The majority of these costs are associated with energy-efficient renovations, and to a lesser extent, the installation of climate-friendly heating systems such as heat pumps.
The energy sector also accounts for a significant share of the investment needs for the energy transition, with EUR 52–60 billion per year (Figure Z.2c, technology scenarios). The expansion of renewable electricity generation and the strengthening of the electricity grids play a crucial role in this context.
Battery electric cars and trucks are projected to reach a market volume of EUR 80 billion per year by 2030. The additional investments for alternative drives amount to only around EUR 5–8 billion per year, as the costs of electric vehicles are expected to decrease relative to comparable internal combustion engine vehicles. In addition, in the transport sector, investments in charging infrastructure will total EUR 5 billion per year (Figure Z.2c, technology scenarios).
The climate-neutral transformation of industry will require an annual investment of EUR 11 billion from 2025–2045 for fuel switching, energy efficiency, installations for new processes and CO2 capture (Figure Z.2b). While investments in this sector are relatively low compared to other sectors, significant additional costs arise from higher operating expenses, since climate-neutral energy carriers (e.g. hydrogen) are more expensive than the fossil fuels used to date (Chapter Z.3).
The significant investments driven by the energy transition present an opportunity for economic modernisation and economic recovery. Large future markets are emerging for green technologies such as battery electric vehicles, heat pumps, solar energy, wind turbines, electrolysers, heat and power storage, as well as platform technologies for the electrification of industrial processes.
Z.3 Structure of sectoral costs for climate neutrality
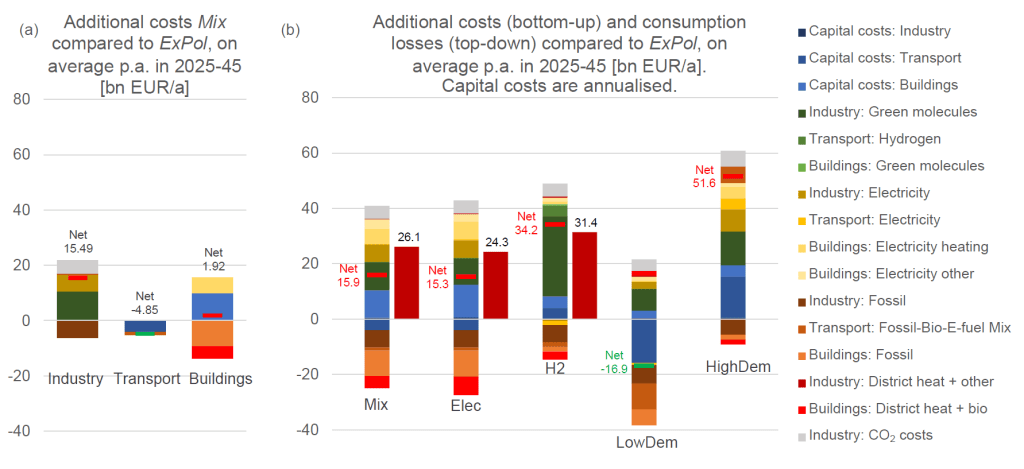
The energy transition alters cost structures and leads to both additional costs and savings, which vary significantly across the end-use sectors buildings, transport and industry (Figure Z.3a). These additional costs and savings result from a combination of shifts in capital expenditures and changes in energy consumption and CO2 emission costs. Additional energy costs arise due to temporarily increased electricity prices, driven by the allocation of grid expansion costs to electricity consumers, rising fossil fuel prices (as a result of higher CO2 prices) and, almost exclusively in industry, expensive non-electric green energy carriers (e.g. hydrogen). On the other hand, energy costs decrease through more efficient energy use, primarily due to technology shifts, such as the use of heat pumps or electric vehicles. Based on these model results, annual additional costs or savings – calculated as the sum of annualized capital and operating costs – can be quantified and compared across scenarios.
The wholesale electricity price is expected to stabilize in the long term at an annual average of 70-80 EUR/MWh. However, prices show a greater variability over the course of the year than they do today. Grid charges for end customers are projected to rise between 2025 and 2030 due to grid expansion costs, but will decline thereafter as electricity demand increases. Notably, the investments required for transmission grids by 2045 can be reduced by approximately EUR 92 billion through integrated system planning with regional electricity prices. This approach enables more system-friendly siting and operation of generation and flexibility assets.
End-user electricity prices are projected to fall below 2020 levels by 2045, except in energy-intensive industries. This trend is driven by the long-term decline in wholesale electricity prices and the distribution of grid charges across a larger customer base (see above). Developments in the industrial sector, however, depend heavily on assumptions regarding the gradual phase-out of existing electricity consumption-related privileges, which create disincentives for flexibility from a system perspective.
The production costs of green hydrogen in Germany are projected to be 156 EUR/MWh in 2030, falling to 110 EUR/MWh in 2045. This means that hydrogen will remain an expensive energy carrier in the long term – especially compared to electricity.
In industry, additional energy costs (primarily for hydrogen and its derivatives) are the dominant cost factor, while capital costs play a comparatively minor role. Although fossil energy costs in the Technology Mix scenario are on average EUR 6 billion lower per year between 2025 and 2045 compared to the Existing Policies scenario, this is offset by additional costs for green molecules amounting to EUR 8–29 billion per year (Figure Z.3b).
By 2030 at the latest, operating an electric vehicle becomes more cost-effective than buying a new combustion engine vehicle for nearly all end users, and in most cases this is already true today. This is demonstrated by a comparison of costs per kilometer driven, which accounts for both purchase and operating costs over the vehicle’s lifetime. While electric vehicles still tend to have higher upfront costs in the short term, these are offset by lower energy and maintenance expenses.
Overall, the target-aligned scenario results in annual savings of EUR 4.9 billion in the transport sector (Technology Mix compared to Existing Policies). This is because the low additional costs for electricity are more than offset by reduced spending on fossil fuels (in combination with biofuels and e-fuels) and, in the long term, lower capital expenditures for electric vehicles (Figure Z.3a).
Heat pumps can reduce heating costs in new buildings and existing buildings with good thermal insulation. While heat pumps have higher upfront costs compared to gas heating systems, these are offset by lower energy costs for electricity relative to natural gas (also due to rising CO2 prices). Additional costs primarily arise from retrofitting poorly insulated buildings. Overall, the buildings sector sees additional costs of EUR 1.9 billion per year (Technology Mix compared to Existing Policies), since energy expenditure savings do not offset the higher investment costs across the sector on average (Figure Z.3a).
Additional costs in industry are concentrated in the basic materials industry. Basic materials include metal production, basic chemicals, the glass and ceramics industries, as well as the cement and lime sectors. In these areas, costs increase significantly due to the use of hydrogen, CO2 pricing, investments in climate-neutral production facilities, and the deployment of CO2 capture technologies along with infrastructure for CO2 transport and storage. In the Technology Mix scenario, the additional costs amount to an average of EUR 15.5 billion per year across the sector between 2025 and 2045 compared to the Existing Policies scenario (Figure Z.3a).
Z.4 Overall picture
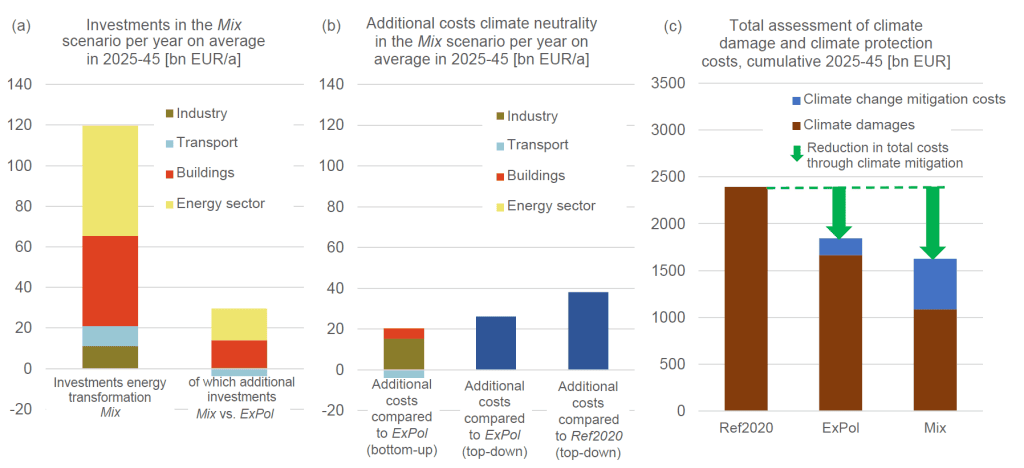
Cost-efficient energy transition strategies can achieve climate neutrality by 2045 at total additional annual costs of EUR 16–26 billion. These additional costs for climate neutrality in 2045 are derived from a scenario comparison (Technology Mix versus Existing Policies), using both a top-down estimate from the overall system model REMIND and the combined bottom-up estimates from the sectoral models FORECAST, ALADIN and REMod. While the overall system model projects additional annual costs of EUR 26 billion, the sum of the net additional costs estimated by the sectoral models amounts to EUR 16 billion per year through 2045 (Figure Z.4b).
Electrification reduces costs across all end-use sectors (Figure Z.3b). This is shown by model results from scenarios with varying levels of electrification (Technology Mix and Electrification Focus compared to Hydrogen Focus). Scenarios with a high degree of electrification consistently perform better in terms of overall cost efficiency.
Cost efficiency requires a targeted use of hydrogen and e-fuels. Hydrogen and e-fuels play an important role in the decarbonisation of non-electrical energy demands. However, if they are used more broadly – as in the Hydrogen Focus scenario – the additional climate change mitigation costs increase to EUR 31–34 billion per year. The primary driver of these additional costs is the increased use of hydrogen in industry (Figure Z.3b)
The transformation of energy demand is a key determinant of climate change mitigation costs. High public acceptance and an accelerated market uptake of demand-side climate technologies – such as electric vehicles, heat pumps, and climate-friendly lifestyles – can lead to annual savings of EUR 17 billion (scenario LowDem) compared to the reference scenario Existing Policies. Conversely, slow uptake of climate friendly lifestyle, energy and technologies in demand sectors significantly increases costs, raising them to EUR 52 billion per year (scenario HighDem) (Figure Z.3b).
Government support programmes help to promote the market uptake of new technologies, to build out infrastructure, and to mitigate additional burdens. A mid-range estimate based on the scenarios – assuming a continuation of current funding paradigms – indicates fiscal needs of approximately EUR 40 billion per year by 2030 for the Technology Mix scenario.
Key components include government-funded subsidies for the Renewable Energy Act (“Erneuerbare-Energien-Gesetz”, EEG), support for energy-efficient building renovation, and incentives for climate-friendly production. Additional interventions, such as state-funded reductions in electricity grid fees or an expansion of carbon contracts for difference incentivizing climate-neutral processes, significantly increase fiscal needs. These expenditures are offset by revenues of approximately EUR 50 billion from carbon pricing in 2030.
The additional costs of achieving climate neutrality are significantly lower than the avoided climate damages. This conclusion is based on a cost-benefit assessment of climate action. The benefits were estimated in terms of avoided climate damage resulting from Germany’s reduced greenhouse gas (GHG) emissions (UBA 2024). The costs are derived by comparing a scenario that achieves climate neutrality by 2045 with scenarios that account only for currently adopted climate policies or include very limited climate action (Technology Mix compared to Existing Policies and Reference20202The Reference2020 scenario reflects only those climate policies that had been implemented by 2020.). The results show that ambitious climate action more than halves expected climate damages, and the economic benefits clearly outweigh the costs (Figure Z.4c)
References
Agora Energiewende 2025, Die Energiewende in Deutschland: Stand der Dinge 2024. Rückblick auf die wesentlichen Entwicklungen sowie Ausblick auf 2025
Burger 2025, Stromerzeugung in Deutschland im Jahr 2024. Fraunhofer ISE
Copernicus Climate Change Service 2024, Copernicus: 2024 virtually certain to be the warmest year and first year above 1.5°C. https://climate.copernicus.eu/copernicus-2024-virtually-certain-be-warmest-year-and-first-year-above-15degc
Global Carbon Project 2024, Fossil fuel CO2 emissions increase again in 2024. In: Global Carbon Budget. https://globalcarbonbudget.org. Accessed 27 Dec 2024
SynErgie 2024, Flexibilitätspotenzial der deutschen Industrie. https://synergie-projekt.de/ergebnis/flexpotenzial-industrie
UBA 2024, Gesellschaftliche Kosten von Umweltbelastungen. https://www.umweltbundesamt.de/daten/umwelt-wirtschaft/gesellschaftliche-kosten-von-umweltbelastungen#methodik-zur-schatzung-von-klimakosten-. Accessed 2 Jan 2025