
Table of Contents
Abstract
The European Union (EU) has pledged to reduce greenhouse gas (GHG) emissions until the year 2030 by 55% compared to 1990. Currently, a central debate within the EU institutions concerns the introduction of a new Emission Trading System for road transport and buildings (ETS2) in addition to the current EU ETS. Contested design features are the split of the carbon budget between the EU ETS and the remaining sectors regulated under the Effort Sharing Regulation (ESR), the carbon price level of the ETS2, and the scope in terms of whether to initially regulate only commercial entities or all consumption. In this paper we conduct a multi-model assessment to shed light on the former two. We find that shifting the budget between EU ETS and ESR sectors in the discussed range seems to be favorable from an economic efficiency point of view. However, the impact on overall welfare is relatively low, given current knowledge about abatement costs. We also find that if carbon prices are the only instruments used, the carbon prices that would be necessary to reach the emission targets range from 130 to 210 €/tCO2 in the EU ETS and from 175 to 350€/tCO2 for the energy-related ESR (ESR-E) emissions – depending on technology development and baseline assumptions of the different models. Our results imply that if the ETS2 price were capped at 50€/tCO2 as discussed by the European Parliament, the abatement target will not be reached with a carbon price alone. The remaining abatement would need to come from complementary policies like technology standards or subsidies, and abatement costs from these policies would be above 50€/tCO2. In this case, effective costs for consumers would very likely exceed the costs of carbon pricing alone due to inefficiencies that arise from the lack of flexibility to mitigate emissions where it is cheapest.
1. Introduction
The European Union (EU) has pledged to reduce greenhouse gas (GHG) emissions until the year 2030 by 55% compared to 1990. The resulting carbon budget is allocated mainly to two different sectoral categories: First, the EU Emissions Trading System (EU ETS) regulates energy intensive industries, air, and water transport. It imposes a single cap on carbon emissions in the EU, defining the annual emission budget. Second, the Effort Sharing Regulation (ESR) and the Land Use, Land-Use Change and Forestry (LULUCF) regulation regulate the remaining emissions. For these emissions there is an individual carbon budget for each member state (MS), i.e., the ESR regulates allocation of the emission budget across countries. The ESR allows, however, that MS partly trade these emission rights. In addition, the European Commission has proposed to introduce a new Emission Trading System for road transport and buildings (ETS2).
The EU therefore needs to decide how to allocate the carbon budget across sectors and MS. Two major options exist. First, extending the EU ETS to cover all sectors leading to one EU-wide cap and a uniform European carbon price. This delegates the final allocation of the fixed carbon budget across sectors, countries and installations to the market. Second, maintaining the current sectoral scopes and deciding about the respective carbon budgets for the EU ETS and the ESR sectors.
In the short term, a full European trading system is politically unlikely. Therefore, the EU needs to decide about the carbon budget under the EU ETS and under the ESR, respectively. This decision will impact the cost of reaching the climate targets. In the current proposal, the European Commission (EC) suggests to attribute 64% of the remaining 2030 GHG emissions budget to the ESR sectors and the rest to the EU ETS. According to the EC’s impact assessment, this split results in EU ETS and ETS2 price estimates of around 50€/tCO2 for a scenario with strong additional measures in complement to carbon pricing (MIX). For a scenario with less stringent additional measures (MIX–CP) the ETS2 price estimate increases to 80€/tCO2.
Given the multitude of factors and assumptions that influence the optimal budget allocation and carbon prices, such an assessment should preferably be grounded on multiple model assessments covering a broad range of methodological, technological, and behavioral assumptions. We thus conduct a multi-model assessment using four different models to put the EC’s proposal in perspective by addressing the two questions: First, what is the optimal allocation of the EU carbon budget to EU ETS and ESR sectors? Second, what are the resulting carbon prices? Our answer to these questions is not a number, but a range representing best guesses based on different approaches.
As several of the models contributing to this study focus exclusively on CO2 emissions, we convert the EC’s proposed GHG-based ESR share of 64% into an energy-related CO2-based ESR-E share of 62-63%. This implies that our ESR-E sector has a rather high overlap with the ETS2 sectors as proposed by the EC. We find that optimally between 60 and 70% of the total carbon budget should be allocated to the ESR-E sectors. The EC’s choice of 62-63% thus lies at the lower end of the optimal allocation. However, our assessment also shows that within a range of around 55-70%, varying the split between ESR-E and EU ETS shares does not significantly affect total welfare.
Regarding the second question, for the proposed split of the carbon budget, our models provide EU ETS price estimates of 130 to 210€/tCO2 that would be necessary to reach the emission targets in the absence of new additional policies. For the ESR-E sectors, carbon prices between 175 and 350€/tCO2 would be necessary to reach the targets if a carbon price is the only new instrument used to reach the target. These price estimates depend on technology development and baseline assumptions of the different models. However, they all clearly lie above the EC’s estimates of 50 to 80€/tCO2. Importantly, we assume that MS trade their carbon budgets, i.e., countries do not necessarily reach their individual ESR targets but the EU-wide ESR target is met. This assumption implies that trade of Annual Emission Allocations (AEA) between MS works without constraints. However, in practice, AEA trade seems to face significant political barriers, leading to heterogeneous carbon prices across MS and, thus, higher total abatement costs.
Our results have two implications for the current policy debate: First, if the ETS2 price were capped at 50€/tCO2 – as discussed by the European Parliament – the abatement target cannot be reached with a carbon price alone. The remaining abatement would require complementary policies like technology standards or subsidies, and abatement costs from these policies would be exclusively above 50€/tCO2. In this case, effective costs for consumers would very likely exceed the costs of carbon pricing alone due to the inefficiencies that arise from the lack of flexibility to mitigate emissions where it is cheapest. Second, whereas the EC has proposed to reduce EU ETS emissions by 61%, the EU Parliament currently discusses to increase the EU ETS ambition. In contrast to our analysis, a corresponding reduction of ESR targets is not discussed in the EU parliament. Yet, we find that such a shift seems to be favorable from an economic efficiency perspective. However, shifting the budget between EU ETS and ESR sectors in the discussed range has a relatively low impact on overall welfare, given current knowledge about abatement costs.
2. Numerical Approach
We use four different models to examine the cost implications of allocating the EU carbon budget between the EU ETS and the ESR-E sectors. The models differ in several dimensions including the model type and assumptions on technological developments, energy efficiency potentials, and political measures along the baseline path (see Table 1 and Table 2 in Appendix). We interpret these differences as uncertainty about future outcomes and therefore do not aim to harmonize these assumptions. Besides the scenario specifications and harmonization of outcome measures to ensure comparability of the results, we thus keep model harmonization at a minimum.
2.1 Models
We use four different models1Detailed model overviews can also be found in the Scenario Report of Kopernikus-Projekt Ariadne (2021) (German only): https://ariadneprojekt.de/media/2021/10/Ariadne_Szenarienreport_Oktober2021_Appendix_Modellbeschreibungen.pdf:
- REMIND-EU (Regional Model of Investments and Development; Baumstark et al., 2021; Luderer et al., 2020, Pietzcker et al. 2021) is a global multi-regional energy-economy-climate model combining an economic growth model with detailed modelling of the energy, agriculture, and climate system.
- TIMES-PanEU is a multi-regional model containing all countries of the European Union of 27 Member States (EU27) and UK, Switzerland and Norway. The model minimizes an objective function representing the total discounted system costs over the time horizon from 2010 to 2050 and assumes perfect competition among different technologies and pathways of energy conversion (Blesl et al. 2010; Blesl 2014; Kattelmann et al. 2021).
- NEWAGE (National European Worldwide Applied General Equilibrium; Beestermöller, 2017, Fahl et al., 2019) is a global recursive-dynamic multi-region Computable General Equilibrium (CGE) model. It represents electricity production in a detailed manner using discrete generation technologies. Data sources include GTAP 9 (Aguiar et al., 2016), EXIOBASE 3 (Stadler et al., 2018), various IEA data and others.
- ZEW CGE (Abrell and Rausch, 2021; Abrell et al., 2022) is a global static multi-region CGE model. It represents electricity production in a detailed manner using discrete generation technologies.
2.2 Scenarios
Relation of Scenarios and Policy Proposals
While the models used in our analysis are well suited to assess the fundamental design choices of the current policy debate, they are not in all aspects an accurate reflection of the political reality. In particular, the following points need to be kept in mind for the interpretation of our results:
Sectoral and GHG coverage: The analysis focuses on energy-related CO2-emissions, i.e., we abstract from non-energy-related CO2 as well as other GHG emissions.2Some models however do model total GHG emissions (see Appendix). However, to the sake of comparability, we focus on energy-related CO2 emissions in our analysis. This implies that our ESR-E sector has a high overlap with the ETS2 sectors as proposed by the EC.
In reality, the sectoral scope of the ESR and the ETS2 overlap to a lower extent: While the ETS2 would cover only emissions from buildings and road transport, the ESR covers all emissions that are not subject to the EU ETS except LULUCF emissions and removals, and thus includes emissions from agriculture, waste, domestic navigation and small industries on top of the emissions from buildings and road transport covered in the ETS2 (European Commission 2021). Currently, the EU parliament even discusses that at the beginning only emissions from commercial road transport and buildings are covered by the ETS2. However, as our analysis looks at 2030, we assume that by this time also private road transport and buildings will be regulated under ETS2.
Complementary instruments: In our scenarios, carbon prices are the only new instrument to reach the 2030 targets. They are implemented mimicking cap-and-trade systems, i.e., we impose a quantitative limit on emissions and the models endogenously determine the according carbon price. Other than that, we do not implement additional policies to achieve the emission reduction relative to the baseline of the respective model. Some models, however, include additional policies in their baseline projection. Thus, part of the differences in results are driven by more optimistic baseline (policy) assumptions (see Appendix).
Carbon trading is likely continued to be supplemented by accompanying measures such as renewable support schemes, energy efficiency measures, and transport policies. The absence of additional policy measures in our scenarios has thus strong implications for the interpretation of our carbon prices: They should be regarded as implicit carbon prices or, likewise, marginal abatement cost. Complementary measures in the form of technology standards or subsidies would thus reduce these carbon prices but increase total abatement costs due to inefficiencies that arise from the lack of flexibility to mitigate emissions where it is cheapest.
AEA trade: In our analysis we assume that countries make use of the existing flexibility option to trade their Annual Emission Allocation (AEA). I.e., countries that overachieve their annual ESR-targets sell their allowance surplus to countries that miss their targets. This is beneficial from an economic efficiency point of view as emissions are reduced where it is cheapest. This assumption also implies that in our models, AEA trade under the ESR-E leads to an equivalent abatement outcome as the ETS2 (assuming they cover the same sectors). However, in practice, AEA trade faces significant barriers, leading to heterogeneous carbon prices across MS and higher total abatement costs.
We examine the cost implications of allocating the EU carbon budget between the EU ETS and the ESR-E sectors in a common scenario framework. In all scenarios, we implement the 2030 target of 55% GHG reduction compared to 1990. We vary the allocation of the carbon budget between the EU ETS and ESR-E by varying the share of the ESR-E in the total EU carbon budget. We assume carbon trading under the EU ETS and under the ESR-E leading to two European carbon prices. In addition to the EU ETS/ESR-E system, we also model a Fulltrade scenario as reference point. The Fulltrade scenario implements a single EU carbon trading system resulting in a single carbon price.
3. CO2-price ranges across models
Figure 1 shows carbon prices for the EU ETS and the ESR-E sectors depending on the share of the carbon budget allocated to the ESR-E sectors. The higher this share in the budget split, the more abatement needs to take place in the EU ETS sectors. As expected, the EU ETS prices (left panel) increase and ESR-E prices (right panel) decrease with a higher ESR-E budget. The black dotted line indicates the price ceiling as discussed by the EU parliament.
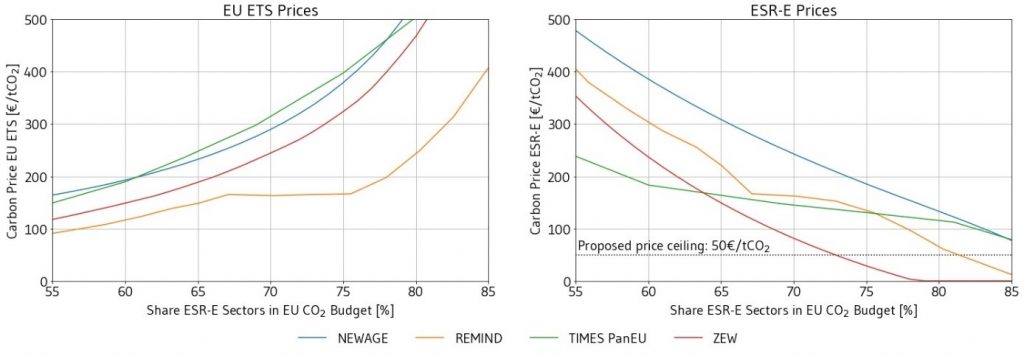
Note: Own calculations. Graphs show implicit carbon price (y-axis measured in €2021/tCO2), i.e., marginal abatement cost, of EU ETS (left panel) and ESR-E (right panel) depending on the allocation of the 2030 EU carbon budget (x-axis). The budget allocation is expressed as the share of energy-related carbon allocated to the ESR-E sectors. Moving from the left to right therefore corresponds to a reallocation of the carbon budget from the EU ETS to the ESR-E and, therefore, increases (decreases) the EU ETS (ESR-E) abatement effort. The black dotted line indicates the price ceiling as discussed by the parliament.
Figure 2 shows the model results for the budget allocation proposed by the EU commission. The EU ETS prices range from 130 to 210 €/tCO2, whereas ESR prices lie between 175 and 350 €/tCO2. Given the large range of different model types, this range is surprisingly narrow.
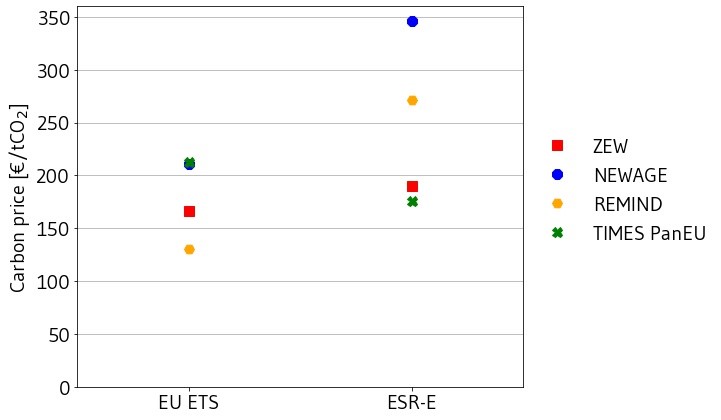
Note: Own calculations. The graph shows implicit carbon prices (left axis measured in €2021/tCO2) of each model for the EU ETS (left) and the ESR-E (right panel) sectors under the budget allocation as proposed by EC, i.e., about 62-63% of energy related carbon emissions.
The results lead to three main insights: First, our EU ETS and ESR-E price estimates lie well above the 50 to 80€/tCO2 that are reported by the EC’s impact assessment. This price difference can partly be explained by the fact that the impact assessment includes a broad range of additional policies whereas our models focus on carbon pricing. As the stringencies of complementarity policies essentially depend on the individual Member States, there is a chance, that – in the absence of a price cap – prices would be higher than currently reported by the Commission. However, if the ESR-E price is capped at 50€/tCO2 as discussed by the EU parliament, substantial abatement has to come from complementary policy measures such as technology standards or subsidies in order to sufficiently reduce emissions in the ESR-E sectors.
Second, the range of the ESR-E price is broader than the one of the ETS. This reflects much larger uncertainties about abatement cost and additional policies in ESR-E sectors compared to the EU ETS sectors. For example, in the electricity sector abatement cost are relatively well known. In contrast, in the buildings and transport sectors we have less information and certainty on abatement cost and demand elasticities as they depend on many uncertain factors including household behavior.
Third, the low price difference between EU ETS and ESR-E prices at the proposed budget split indicates that the gains of carbon trade between ESR-E and EU ETS sectors are limited. This implies that the proposed split of carbon budgets between sectors is relatively well chosen.
In the next section, we analyze the potential welfare gains of different budget allocations in detail.
4. Optimal allocation of the EU carbon budget
Figure 3 provides the EU ETS and ESR-E carbon price depending on the carbon budget allocation together with the welfare measure of the respective model. Whereas the CGE models (NEWAGE, ZEW CGE) directly provide economic welfare, REMIND reports the gross domestic product (GDP) and TIMES-PanEU reports energy system cost. Since demand in TIMES-PanEU is constant, changes in cost are equivalent to changes in economic welfare. Welfare changes are measured relative to the Fulltrade scenario which implements a uniform carbon price across the EU and, therefore, provides an indicator for the regulatory approach with lowest abatement cost.3For models that implement commodity and/or income and/or final energy taxation (NEWAGE, ZEW CGE, REMIND), the optimal, i.e., least cost solution, might slightly deviate from the Fulltrade scenario due to tax interaction effects (e.g., Boeters, 2014; Goulder, 1995). From these results we can derive the following three main insights:
First, CO2 prices under Fulltrade range from 163€/tCO2 to 266€/tCO2. Again, they are significantly higher than the prices reported by the EC.
Second, under the Fulltrade scenario, the models allocate between 60% and 70% of the EU’s carbon budget to the ESR-E sectors. Therefore, the proposed budget split of 62-63% is at the lower end of this range.
Third, the relatively flat cost curves indicate that a slight variation in the allocation of carbon budgets between EU ETS and ESR-E sectors has no major consequences on welfare. This implies that slight changes of the split of several per cent do not significantly affect welfare. However, when more than around 70% of the total budget is allocated to the ESR-E budget, EU ETS prices start to increase more steeply, reducing welfare substantially.
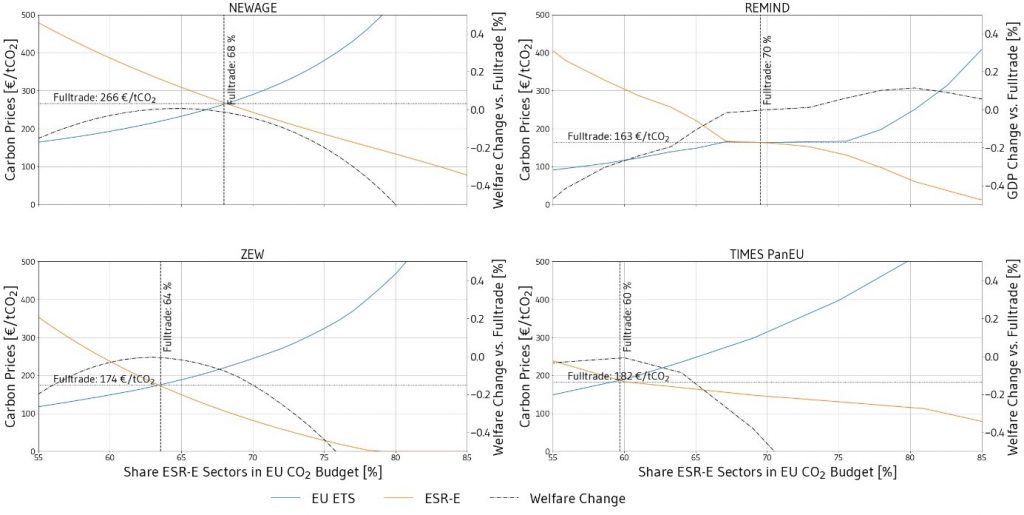
Note: Own calculations. The graphs show implicit carbon prices (left axis measured in €2021/tCO2) for the EU ETS (blue line) and the ESR-E (orange line) depending on the allocation of the EU energy-related carbon budget (x-axis) for each model. The right axis measures the welfare cost of deviating from a single EU carbon price uniform across all sectors (black dash-dotted line). The horizontal dotted line shows the respective EU-wide uniform carbon price (fulltrade). The vertical dotted line depicts the carbon budget allocation under this uniform price.
5. Conclusion
We provide a multi-model assessment of the allocation of the carbon budget to EU ETS and ESR-E sectors based on four models. We find that the emission share allocated to the ESR-E sectors of around 62-63% (64% based on total GHG emissions) proposed by the Commission is at the lower end of the optimal range determined by the models. Yet, none of the models shows a major welfare loss for the budget split proposed by the EC compared to the optimal split. More explicitly, in our modelling framework, the welfare cost of a separated EU climate policy relative to a uniform carbon price are surprisingly invariant to the allocation of the EU carbon budget.
For the budget allocation as proposed by the EC, our models show an EU ETS price range from 130 to 210€/tCO2 and an ESR-E price range of 175-350€/tCO2. These ranges are well above prices reported by the EC.
This has several implications for the current policy debate: First, if the ETS2 price were capped at 50 €/tCO2 as discussed by the European Parliament, more stringent complementary policies will be needed to reach the target. While in this case the observed carbon prices will be relatively low, the total abatement costs for consumers will be even higher due to inefficiencies that arise from the lack of flexibility to mitigate emissions where it is cheapest. Second, a slightly more ambitious reduction target in the EU ETS sectors as discussed by the EU parliament could be favorable from an economic efficiency perspective if the ESR targets would be reduced accordingly. Finally, welfare effects are relatively invariant to smaller shifts in the budget split. Thus, if further adjustments are needed in the course of the ongoing negotiations, the effect on overall welfare would be small.
Appendix
Model characteristics
Table 1: Model characteristics
Table 2: Base year and scenario assumptions
This Ariadne analysis was prepared by the above-mentioned authors of the Ariadne consortium. It does not necessarily reflect the opinion of the entire Ariadne consortium or the funding agency. The content of the Ariadne publications is produced in the project independently of the Federal Ministry of Education and Research.
References
Abrell, J, Huang, P, Rausch, S, 2022. Fixing Fragmented Carbon Marktes in Europe. Mimeo.
Abrell, J, Rausch, S, 2021. A Smart Design of New EU Emissions Trading Could Save 61 Per Cent of Mitigation Costs, ZEW policy brief Nr. 21-05, Mannheim.
Aguiar A, Narayanan B, McDougall R, 2016. An Overview of the GTAP 9 Data Base. Journal of Global Economic Analysis 1, no. 1: 181-208. https://jgea.org/ojs/index.php/jgea/article/view/23
Baumstark L, Bauer N, Benke F, Bertram C, Bi S, Gong CC, Dietrich JP, Dirnaichner A, Giannousakis A, Hilaire J, et al., 2021. REMIND2.1: Transformation and innovation dynamics of the energy-economic system within climate and sustainability limits. Geoscientific Model Development Discussions: 1–50 DOI: 10.5194/gmd-2021-85.
Beestermöller R, 2017. Die Energienachfrage privater Haushalte und ihre Bedeutung für den Klimaschutz – Volkswirtschaftliche Analysen zur deutschen und europäischen Klimapolitik mit einem technologiefundierten Allgemeinen Gleichgewichtsmodell. Eigenverlag, Stuttgart (Forschungsberichte des Instituts für Energiewirtschaft und Rationelle Energieanwendung; ISSN 0938-1228) [Aufruf am: 30.09.2021] URL: http://dx.doi.org/10.18419/opus-9123.
Blesl M, Kober T, Bruchhof D, Kuder R, 2010. Effects of climate and energy policy related measures and targets on the future structure of the European energy system in 2020 and beyond. Energy Policy, 38(10): 6278–6292 DOI: 10.1016/j.enpol.2010.06.018.
Boeters, S, 2014. Optimallly differentated carbon prices for unilateral climate policy. Energy Economics, 45: 304–312.
European Commission (2021): Proposal for a regulation amending Regulation (EU) 2018/842 on binding annual greenhouse gas emission reductions by Member States from 2021 to 2030 contributing to climate action to meet commitments under the Paris Agreement, COM(2021) 555 final.
Fahl U, Gaschnig H, Hofer C, Hufendiek K, Maier B, Pahle M, Pietzcker R, Quitzow R, Rauner S, Sehn V, et al., 2019. Das Kopernikus-Projekt ENavi – Die Transformation des Stromsystems mit Fokus Kohleausstieg. [Aufruf am: 30.09.2021] URL: http://dx.doi.org/10.18419/opus-10519.
Goulder, L, 1995. Effects of Carbon Taxes in an Economy with Prior Tax Distortions: An Intertemporal General Equilibrium Analysis.” Journal of Environmental Economics and Management, 29(3): 271–297.
IEA, 2020. World Energy Outlook. https://www.iea.org/reports/world-energy-outlook-2020
Kopernikus-Projekt Ariadne, 2021: Ariadne-Report: Deutschland auf dem Weg zur Klimaneutralität 2045 – Szenarien und Pfade im Modellvergleich. https://doi.org/10.48485/pik.2021.006
Luderer G, Bauer N, Baumstark L, Bertram C, Leimbach M, Pietzcker R, Strefler J, Aboumahboub T, Auer C, Bauer N, et al., 2020. REMIND – REgional Model of INvestments and Development. Zenodo DOI: 10.5281/zenodo.3899869.
Loulou R, Kanudia A, Lethila A, Goldstein G, 2016a. Documentation for the TIMES Model, Part I. [Aufruf am: 30.09.2021] URL: https://iea-etsap.org/docs/Documentation_for_the_TIMES_Model-Part-I_July-2016.pdf
Loulou R, Goldstein G, Lettila A, Remme U, 2016b. Documentation for the TIMES Model, Part II. [Aufruf am: 30.09.2021] URL: https://iea-etsap.org/docs/Documentation_for_the_TIMES_Model-Part-II_July-2016.pdf.
Luderer G, Bauer N, Baumstark L, Bertram C, Leimbach M, Pietzcker R, Strefler J, Aboumahboub T, Auer C, Bauer N, et al., 2020. REMIND – REgional Model of INvestments and Development. Zenodo DOI: 10.5281/zenodo.3899869.
Pietzcker, R.C., Feuerhahn, J., Haywood, L., Knopf, B., Leukhardt, F., Luderer, G., Osorio, S., Pahle, M., Dias Bleasby Rodrigues, R., Edenhofer, O., 2021. Notwendige CO2-Preise zum Erreichen des europäischen Klimaziels 2030. https://doi.org/10.48485/pik.2021.007
Stadler K, Wood R, Bulavskaya T, Södersten C-J, Simas M, Schmidt S, Usubiaga A, Acosta-Fernández J, Kuenen J, Bruckner M, et al., 2018. EXIOBASE 3: Developing a Time Series of Detailed Environmentally Extended Multi-Regional Input-Output Tables. Journal of Industrial Ecology, 22, 502–515. https://doi.org/10.1111/jiec.12715
Authors


Süheyb Bilici
Universität Stuttgart – Institut für Energiewirtschaft und Rationelle Energieanwendung


Dr. Ulrich Fahl
Universität Stuttgart - Institut für Energiewirtschaft und Rationelle Energieanwendung

Felix Kattelmann
Universität Stuttgart – Institut für Energiewirtschaft und Rationelle Energieanwendung


Drin Marmullaku
Universität Stuttgart – Institut für Energiewirtschaft und Rationelle Energieanwendung


Jonathan Siegle
Universität Stuttgart - Institut für Energiewirtschaft und Rationelle Energieanwendung