
Table of Contents
Summary
- There has long been a debate about climate-damaging subsidies in the German transport sector, and the financial restrictions resulting from the Federal Constitutional Court’s budget judgement at the end of 2023 have intensified the debate. This dossier is the first to convert the level of subsidies in the transport sector into negative CO2 prices to present a scientific categorisation of their significance for climate policy. The concept of implicit negative CO2 prices shows the extent to which subsidies implicitly reward citizens for emitting a tonne of CO2, rather than paying for the emissions.
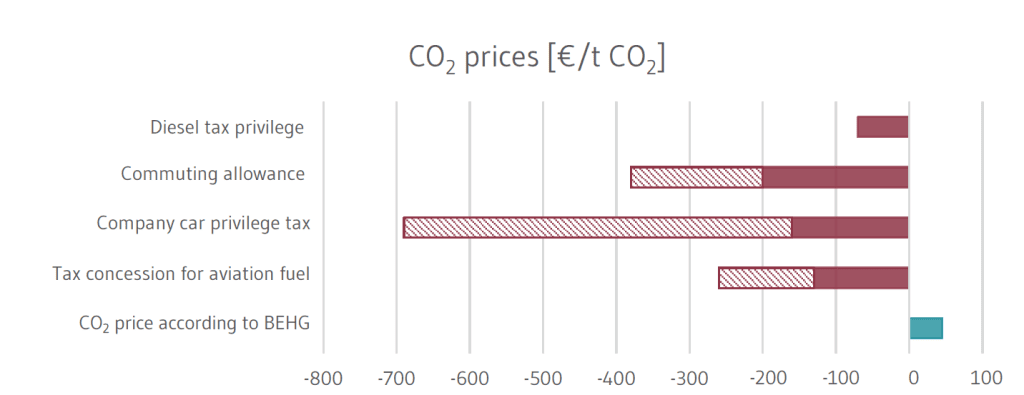
- The implicit negative CO2 prices of four important transport subsidies are quantified: the diesel privilege, the commuting allowance, the flat-rate taxation of privately used company cars, and thtax concession for aviation fuel. These climate-damaging subsidies correspond to negative CO2 prices of between -€70 and -€690 per tonne of CO2 (see Figure 1). Converted into € per litre of petrol, these negative CO2 prices correspond to petrol price reductions of between €0.18 and €1.70 per litre.
- The implicit negative CO2 prices of the subsidies are therefore significantly higher than the actual CO2 price in the Fuel Emissions Trading Act (BEHG), currently €45/t CO2 or around €0.11 per litre of petrol. This shows how strongly the current tax and levy system is still focussed on the use of fossil fuels. The inconsistent price signals between subsidies and BEHG lead to lower emission reductions and higher avoidance costs of CO2pricing.
- High-income households benefit disproportionately from the subsidies. The commuting allowance relieves the middle- to higher-income groups by more than 1% of net income. The distribution effects of the diesel privilege are moderate in macroeconomic terms, but are certainly relevant for those affected, especially those on middle incomes. The privileges in taxation of company cars primarily favour high-income households, as only a few employees with lower or medium incomes have a company car.
- Subsidy reforms are a lever to dampen increased CO2 prices in the BEHG (or ETS-2) from 2027. In the short term, a reform of the diesel privilege offers great potential for CO2 reduction. In the medium term, a reform of the company car privilege can support the ramp-up of e-mobility. A reform of the distance-based tax allowance can contribute to reducing emissions, particularly in the medium and long term. Strengthening the EU-wide pricing of aviation fuel is superior to domestic taxation. Reforms should introduce clearly defined compensation measures.
1 Introduction
The German Federal Climate Protection Act (KSG) sets targets for reducing German greenhouse gas emissions. However, the KSG targets in the transport and buildings sectors have already been missed for several years (UBA, 2023a) and additional measures are required. As a monetary incentive to reduce emissions, a national price was placed on CO2 emissions from fossil fuels consumed in transport and building heating systems in 2021 as part of the Fuel Emissions Trading Act (BEHG). This amounts to €45 per tonne of CO2 in 2024, and will rise to a maximum of €65 in 2026. This is equivalent to €0.13 per litre of petrol and €0.14 per litre of diesel fuel, including value added tax (VAT), at the filling station. At the same time, there has been a debate in recent years about climate-damaging subsidies in the transport sector (UBA, 2021b), which has intensified since the Federal Constitutional Court’s budget judgement in November 2023.
The aim of this dossier is to convert the significant level of subsidies in the transport sector into negative CO2 prices; this contributes to the political discourse by categorising the climate policy significance of the subsidies. The implicit negative CO2 price shows the extent to which subsidies reward consumers for emitting a tonne of CO2, instead of charging them for it. This allows us to compare the actual BEHG CO2 price for transport with the existing tax and levy system, which has historically focussed on fossil fuels. This calculation is based on four important direct and indirect subsidies in the transport sector, and shows which user groups particularly benefit from them.
In this dossier, the term subsidy is used in accordance with common international definitions. In particular, the legally binding definition for World Trade Organization (WTO) member states considers that a subsidy exists when “a government waives or fails to collect taxes normally payable” or otherwise provides direct or indirect financial support (WTO 1994). The OECD builds on the WTO’s definition of subsidies and defines “fossil” subsidies as all types of financial support that serve to favour the production or consumption of fossil energy over alternatives (OECD 2015).1The Federal Environment Agency’s definition of “environmentally harmful” subsidies is similar to the OECD definition (UBA, 2021b). The IMF, on the other hand, goes beyond the OECD in its definition of “implicit” subsidies, which include the costs of environmental damage and tax losses not taken into account in the sales price (Parry, Black and Vernon 2021). If this direct or indirect influence on production or consumption decisions leads to an increase in greenhouse gas emissions, it can be considered a “climate-damaging” subsidy.
In some cases, the subsidies under consideration have been in place for decades and pursued distinct objectives in their past, such as strengthening the international competitiveness of the German haulage industry (diesel privilege), tax simplification (company car privilege) or compensation for the introduction of other taxes (communting allowance and aviation fuel). The means the original objectives and possible conflicts of objectives (e.g. with climate policy), are part of long-standing debates. Our novel contribution to the discussion is that we, for the first time, convert the subsidies into implicit negative CO2 prices.
2 How high are the negative CO2 prices?
Study framework
The following four subsidies have a direct influence on the national CO2 emissions of the German transport sector, and thus the achievement of the sectoral emission reduction targets under the Climate Protection Act:
- The energy tax concession for diesel fuel in accordance with Section 2 (1) no. 4b EnergieStG (hereinafter referred to as the “diesel privilege”)
- The commuting allowance in accordance with Section 9 (1) No. 4 EStG (so-called “commuting allowance”)
- The flat-rate taxation of the non-cash benefit of privately used company cars in accordance with Section 6 (1) no. 4 sentence 2 EStG (hereinafter referred to as the “company car privilege”)
- The tax concession for energy products used in domestic air traffic in accordance with Sections 27 (2) and 52 (1) EnergieStG (hereinafter referred to as “tax concession for aviation fuel”)
The focus of the dossier is therefore on subsidies that affect passenger transport. These subsidies are at the centre of many political discussions and some-times have high financial volumes or affect many people. Subsidies that affect the shipping and freight transport sectors are not included, as they raise more far-reaching questions about international competition effects and require a different analytical framework. Taxes and levies, such as the energy tax or the motor vehicle tax, which primarily serve to finance infrastructure but also implicitly set positive CO2 prices, are also excluded, as they have already been comprehensively analysed in other studies (e.g. OECD 2023). This does not mean that these additional cases are not relevant or interesting, but the aim of this study is an exemplary calculation of the implicit negative CO2 prices for selected frequently discussed subsidies.
Calculation method
The four subsidies considered are explicit (in the case of the diesel privilege and the tax concession for aviation fuel) or implicit (in the case of the commuting allowance and the company car privilege) tax concessions relative to the volume of the respective fuels (Sfuel). Methodologically, the volume-related tax concessions are converted into tax concessions per quantity of CO2 emitted. Using the energy density (Wfuel), which indicates the energy content of a fuel relative to its volume, the subsidy is calculated relative to the energy content of the fuel. Finally, the division by an emission factor (EFfuel) – the CO2 emissions per unit of energy – provides the subsidy, or the implicit negative CO2 price per tonne of CO2 emitted:
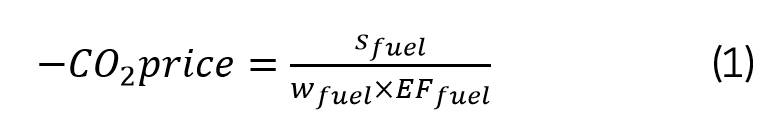
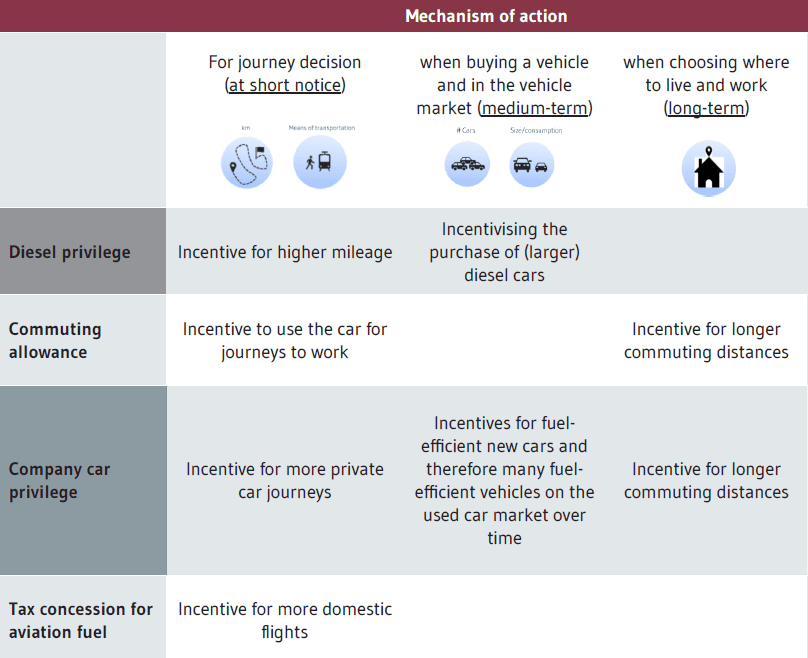
A negative CO2 price is therefore the implicit monetary advantage of emitting the affected quantity of CO2 emissions. It should be noted that this is a negative “implicit” price. In many cases, the subsidy favours fuel and the associated emissions of CO2 indirectly via various incentive channels, which are briefly outlined in Table 1 and discussed in more detail below. It should also be noted that the calculated negative CO2 price reflects the average monetary benefit of all CO2 emissions affected by the subsidy, relative to the CO2 prices under the BEHG that are relevant for transport. There, the values are set by law until the end of 2026 (i.e. they are politically determined). In contrast, the CO2 price in European emissions trading reflects marginal costs (i.e. the additional costs incurred by a participating company as a result of emitting an additional tonne of CO2 (see Section 2.5. for a more in-depth discussion)).
The four subsidies are analysed individually below and then placed in relation to the BEHG price in Section 2.5.
2.1 Energy tax concession for diesel fuel
Since the 1980s, diesel fuels have been taxed at a lower rate than petrol in Germany. Currently, the tax rates are 47.04 ct/l for diesel and 65.45 ct/l for petrol. The tax concession was originally introduced to alleviate the burden of the energy tax for freight transport. In 2023, 98% of medium and heavy commercial vehicles were diesel vehicles. However, cars with diesel engines also benefit from the diesel privilege as a side effect. In Germany, diesel cars accounted for 14.44 million vehicles in 2023, or 29.6% of the total number of passenger cars (UBA, 2023). The number of vehicles has fallen slightly since 2018: around 5.2% fewer passenger cars with diesel engines were registered in 2023 than in 2018.
This dossier focuses on the preferential treatment of diesel cars, as there are other price signals and burdens for heavy goods vehicles (HGVs), via the HGV toll, that are effective in terms of climate policy. At the same time, the planned reform of the EU Energy Tax Directive envisages harmonising the minimum tax rate for diesel and petrol based on energy content (EUR/GJ). The draft directive also provides for a switch, from volume-based taxation to taxation based on energy content, by removing incentives for the use of fossil fuels and introducing a ranking of tax rates according to environmental performance (EU COM/2021/563, 2021).
According to formula (1), negative CO2 prices can be calculated directly based on the energy density and emission factor of diesel fuel. The calculation is based on an energy density of 0.0355 GJ/l and an energy-related CO2 emission factor of 0.074 tCO2/GJ (UBA, 2022a). VAT is neglected. The resulting implicit negative CO2 price of the diesel privilege corresponds to -€70/tCO2. In relation to the current diesel consumption that is subject to energy tax, the state loses revenue totalling €7.2 billion per year as a result of the diesel privilege. Of this, an estimated €2.5 billion is attributable to diesel consumption by private households, which amounts to €3 billion including VAT. The actual additional revenue would be lower, as consumption would fall following the abolition of the diesel privilege, and fewer diesel vehicles would be used in the longer term.
When considering reforms, it must be considered that vehicle tax also applies differentially to diesel and petrol cars. The cubic capacity component of the tax for vehicles with diesel engines is €9.50 compared to €2 per 100 cm³ capacity for petrol engines. Nonetheless, we observe a clear tax advantage for diesel cars across the entire fleet due to the large number of kilometres travelled. The relief provided by the energy tax concession for diesel fuel exceeds the burden of the higher vehicle tax (FÖS, 2023). In the coalition agreement, the German government announced that it would also review the tax treatment of diesel vehicles within vehicle tax when implementing the EU Energy Tax Directive.
2.2 Commuting allowance
The commuting allowance in accordance with Section 9 (1) No. 4 EStG, enables employees and self-employed persons to claim their expenses for travelling between home and work as income-related expenses. The commuting allowance is €0.3/km for all distance kilometres (one way) up to 20 km and €0.38/km from the 21st kilometre onwards, regardless of the actual costs. The commuting allowance is independent of the means of transport and its relief depends on individual income. In addition to journeys to work with an internal combustion engine car, journeys with electric cars, public transport or e-bikes and bicycles are also relieved and thus subsidised. However, the distance to work that can be subsidised is not capped for cars as the only means of transport. This means that the incentives to use the car for journeys to work are particularly pronounced. This is reflected empirically in the fact that cars dominate for journeys to work. The lack of a cap for cars and the high proportion of cars with internal combustion engines make the commuting allowance a climate-damaging subsidy.
In the following, we use two approaches to calculate the level of the implicit CO2 price. On the one hand, tax revenue reductions from the distance-based tax allowance determined in various studies can be set in relation to the affected emissions in order to obtain an implicit negative CO2 price (“macro view”). On the other hand, the direct reduction in fuel costs can be compared using various income tax rates and current fuel prices (“micro view”). Both approaches are briefly presented and then summarised.
Various studies estimate the reduction in tax revenue due to the commuting allowance for cars at €5 to €6 billion per year (Federal Government 2022, Laaser et al. 2023, UBA 2022). According to the Federal Government (2022), the commuting allowance affected a total of 17.8 million tax cases in 2017, 14.8 million of which travelled to work by car. As the deductible costs for car journeys are not capped and 76% of journeys to work are made by car (BMDV 2022), it can be assumed that the majority of the tax reduction relates to car use. Due to the low proportion of battery-powered cars in the fleet, these are neglected in the following. At the same time, the mileage of cars in commuter traffic (i.e. all journeys or journeys between home and work, excluding work-related journeys or journeys from the workplace) is estimated at 165 billion passenger kilometres or 137 billion vehicle kilometres (BMDV 2022). This corresponds to around 30 million tonnes of CO2. This results in an implicit negative CO2 price of just under -€200/t CO2.
In individual cases, the relief provided by the commuting allowance depends on the individual marginal income tax rate and the consumption of the car used. As an alternative to the above “macro view”, the implicit negative CO2 price can therefore also be calculated from the perspective of an individual commuter (“micro view”). To do this, the tax relief effect of the commuting allowance can be halved, i.e. related to the number of kilometres driven, and then converted to litres of fuel and the associated CO2 emissions using the car’s fuel consumption. For a high-earning commuter with a marginal tax rate of 44% (top income tax rate of 42% plus solidarity surcharge) who drives a diesel car with a fuel consumption of 7 litres per 100 km, the commuting allowance then corresponds to a negative CO2 price of -€380/tCO2 for distances over 20 km. A low-income employee working full-time at minimum wage pays a marginal tax rate of 25%, so that the negative CO2 price for the same consumption is -€216/tCO2. The negative CO2 prices are somewhat lower for petrol cars. For more fuel-efficient vehicles or lower consumption per kilometre over longer distances, the negative CO2 prices fall proportionally.
Overall, the exact negative CO2 price depends on the individual case, but the result for the commuting allowance is in the range of -€200 to -€380/tCO2 or on average around -€300/tCO2.
2.3 Company car privilege
Employers sometimes provide their employees with company cars that can also be used privately. The free private use of the company car is an effective salary increase and is therefore taxable as a non-cash benefit for income tax purposes. The same rules apply to self-employed persons who use their company car privately. The non-cash benefit of vehicles with an internal combustion engine only, which are used at least 50% for business purposes, can be determined in two ways, according to Section 6 para. 1 no. 4 sentence 2 EStG:
- Flat-rate taxation: According to the 1% rule, 1% of the gross list price of the vehicle is recognised per month (or 12% per year). In addition, 0.03% of the gross list price is added each month for each kilometre travelled between home and work.
- Logbook method: A logbook is kept so that the proportion of private journeys can be clearly demonstrated. The taxable non-cash benefit is then the company’s total annual costs for this vehicle multiplied by this proportion.
Employees and self-employed persons are free to choose which method they use, however if the company car is used less than 50% for business purposes (i.e. if the company car is mainly used for private purposes), the logbook method must be used. This short report focuses on the flat-rate taxation method, as most company car users are likely to choose this method.2In Agora Verkehrswende (2022), 84% of 101 company car users surveyed used this method. Just under 10% stated that they use the logbook method. At the same time, it is possible that taxpayers apply the 1% rule even though they use the company car predominantly for private purposes. For comparison, Paetzold and Winner (2016) found in their study of Austrian tax data that 30% of all information on the commuting allowance was exaggerated. The Federal Audit Office (2022) criticised tax offices for failing to verify the information on the commuting allowance, and suspects that this results in a loss of revenue in the hundreds of millions. Reduced values apply for electric vehicles, with a flat-rate taxation of 0.25% per month for purely battery-powered vehicles (BEV) and 0.5% per month for plug-in-hybrid vehicles (PHEV), to increase sales of electric vehicles as company cars.
Company car privilege acts as a climate-damaging subsidy, as the non-cash benefit is often higher than the flat rate applied. Estimates show that, as a rule, less than 40% of the actual benefit is taxed (i.e. the monetary benefit is actually around two and a half times higher than the amount being taxed) (Harding 2014, Agora Verkehrswende 2021 & 2022). In the case of vehicles with internal combustion engines, this subsidy harms the climate because more journeys are made due to the de facto benefit (usage costs are around 60% below normal market usage costs). Furthermore, more (and in particular larger) and more fuel-intensive vehicles are often purchased than would be the case with purely private financing, as no operating costs have to be paid. This causes more emissions than would be the case with normal market utilisation costs. From a usage perspective, the full coverage of fuel costs for private journeys in particular creates a strong incentive to use the company car instead of other means of transport. Interestingly, the Scientific Service of the German Bundestag (2023) summarises the criticism of the flat-rate taxation of company cars with regard to emissions and social inequality, and concludes that the current regulation on flat-rate taxation of the non-cash benefit of privately used company cars “leads to a de facto indirect favouring of car manufacturers over other mobility providers”. They furthermore state that this justifies the classification as aid within the meaning of European law.
We use two approaches to calculate the level of the implicit CO2 price. First, the reduced tax revenue from the company car privilege determined in various studies can be set in relation to the affected emissions to obtain an implicit negative CO2 price (“macro view”). On the other hand, the direct reduction in fuel costs can be set in relation to various income tax rates and current fuel prices (“micro view”). Both approaches are briefly presented and then summarised.
From a macro perspective, around two million new cars are registered to commercial owners in Germany every year, around half of which are company cars (i.e. around one million company cars per year). More than 10% of all cars in Germany are registered for commercial use. How many of these are classic company cars is not recorded statistically. According to estimates based on FiFo (2011) and extrapolated to the year 2020, there are around 3.5 million company cars in Germany (approx. 7% of all cars). With an average annual mileage of 25,000 km for company cars, this results in approx. 8 to 12.8 million tonnes of CO2 from private journeys per year, depending on the extent of private use.3We assume here that 50–80% of the kilometres are private (this is a rather low estimate, as in Sweden and the Netherlands over 80% of company car kilometres are private, see Börjesson & Roberts (2023); journeys to the place of work, for example, are not working time and are therefore also counted as private journeys) and assume an average consumption of approx. 180g CO2/km (157g CO2/km WLTP and 15% surcharge for real emissions, see T&E 2021). Only the direct emissions are taken into account here. If the indirect effects of the flat-rate taxation of company cars on the vehicle fleet were to be taken into account (larger and more motorised new cars are purchased, which are later added to the private car fleet), the affected CO2 emissions would be even higher. FÖS (2023) estimates the shortfall in income tax revenue at €3.5–€5.5 billion per year, Harding (2014) at €5.1 billion.4For orientation, and plausibility of the order of magnitude: with an average list price of €40.000 and an average assumed marginal tax rate of 37%, 3.5 million company cars result in tax revenue reductions of around €6 billion per year compared to a scenario with a flat rate of 2% per month instead of 1% per month. The ratio of the subsidy volume (€3.5–€5.5 billion) and the total CO2 emissions (8–12.8Mt CO2) from company cars results in an implicit negative CO2 price of around -€270/tCO2 (low estimate at €3.5 billion subsidy and 12.8Mt CO2) to -€690/tCO2 (high estimate at €5.5 billion and 8Mt CO2).
From the perspective of an individual company car user, the direct fuel costs and the monetary benefit as a whole are relevant. Unlike the “macro view”, this “micro view” only takes the fuel costs into account in calculating the implicit negative CO2 price, for the sake of simplicity, and other operating costs or capital costs are ignored. The pecuniary benefit from bearing the fuel costs for private journeys depends on fuel prices and the marginal income tax burden. At current fuel prices of just over €1.70/l, this results in implicit negative CO2 prices of -€160/tCO2 for diesel drivers with a marginal tax rate of 25%, to -€330/tCO2 for petrol drivers and a marginal tax rate of 44% (top income tax rate of 42% plus solidarity surcharge).5The CO2 emission factor for diesel is 0.074t/GJ and for petrol it is 0.073t/GJ (UBA, 2022a). The calculations are based on energy densities of 0.03550GJ/l for diesel and 0.03180GJ/l for petrol.
As an implicit negative CO2 price, the company car tax is somewhat more difficult to grasp than simple energy tax concessions for diesel or paraffin. In addition, company cars are not well recorded statistically6The KBA only distinguishes between private and legal persons as owners, and in surveys such as the SOEP, respondent errors and underreporting can occur (see also Footnote 8 below). and the exact implicit negative CO2 price depends on a number of individual factors such as the vehicle model, private mileage and income tax rate. Despite these uncertainties, the calculations show that the implicit negative CO2 price of theflat-rate taxation of the non-cash benefit of privately used company cars is in the range of around -€160/tCO2 to -€690/tCO2 and is therefore considerable.
2.4 Tax concession for aviation fuel
The EU Energy Tax Directive provides for paraffin to be taxed at a rate of at least €0.33 per litre (Directive 2003/96/EC). In Germany, the directive is implemented by the Energy Tax Act (EnergieStG), according to which aviation fuel is taxed at a rate of €0.6545 per litre. However, aviation fuel used in commercial air transport (and for other purposes not considered here) is exempt from this taxation (Section 27 (2) of the Energy Tax Act as a national implementation of Article 14 (1) of Directive 2003/96/EC). This tax concession for aviation fuel constitutes a subsidy.
However, numerous agreements and arrangements, stand in the way or make it more difficult to abolish the subsidy, i.e. tax aviation fuel, in international air traffic between Germany and non-EU countries (p.5, Pache 2005; p.6, Faber and O’Leary 2018). To levy an energy tax on intra-European flights, additional bilateral agreements are required under the EU Energy Tax Directive (Article 14(2), Directive 2003/96/EC). Nevertheless, taxation of domestic air traffic is compatible with European law and international agreements (p.40ff., Pache 2005; Wissenschaftliche Dienste des Deutschen Bundestag, 2020). The EU Energy Tax Directive allows taxation of less than €0.33 per litre of avation fuel (Article 14(2), Directive 2003/96/EC).
In this dossier, we will therefore limit ourselves to the tax concession for energy products used in domestic air traffic, as it is central to the discussion because of its simple possible implementation. See, for example, the 29th Subsidy Report of the Federal Ministry of Finance (BMF, 2023) and numerous analyses on the extent of the tax reduction and the climate impact of the subsidy (e.g. UBA 2019a, 2019b and 2023, Öko-Institut 2021).
To calculate the implicit negative CO2 price of the aviation fuel exemption in domestic aviation, the energy density and emission factor of paraffin are required. The Federal Environment Agency uses an emission factor of 73.3 g CO2/MJ (UBA, 2022). This value is within the reference interval proposed by the IPCC for national emission factors ([69.8 g CO2/MJ, 74.4 g CO2/MJ]) (p.3.64, IPCC, 2019). Based on this emission factor and an assumed energy density of 34.2MJ/l, implicit negative CO2 prices are calculated according to the above formula (1). The tax rate of the national Energy Tax Act and the restrictive tax rate of the EU Directive are assumed. This results in an implicit negative CO2 price of around -€260/tCO2 if the German energy tax rate (€0.6545/l) is assumed and a negative CO2 price of around -€130/tCO2 if the maximum permissible EU tax rate (€0.33/l) is used.
In the 29th subsidy report, based on the national tax rate of €0.6545/l, the Federal Ministry of Finance estimates that this subsidy will reduce tax revenue by €584 million in 2024 (p.563, BMF 2023). In December 2023, the Federal Government decided to increase the air traffic tax to compensate for this shortfall in revenue (p.5, Hebestreit 2023). This is levied on tickets for all flights – national and international – and depends on the flight distance. A distinction is made between three distance classes (Section 11, LuftVStG). Based on the increased tax rates that will apply from 1 May 2024 according to the draft law (p. 2f., German Bundestag, 2024), the increase corresponds to an implicit CO2 price of €28.30/t CO27The average implicit positive CO2 price is calculated for all three commuting classes according to the following formula: CO28 price_distance_class = (tax rate May 2024_distance_class – tax rate Jan 2024_distance_class)/(average flight distance_distance_class x emission factor per passenger kilometre_distance_class). Average flight distances of 1,200km (distance class 1), 4,000 km (distance class 2) and 7,500 km (distance class 3) are assumed. Graver et al. (2019) provide average emission factors per passenger kilometre for intra-European flights (86g CO29/km; distance class 1) and flights between Europe and the Middle East (86g CO210/km; distance class 2). The average value of the emission factors for flights between Europe and North America, Europe and Asia/Pacific, Europe and Latin America/Caribbean and Europe and Africa provides the emission factor for flights in distance class 3 (83g CO211/km). The aviation fuel tax rates (from Jan 2024: €12.48/ticket (distance class 1), €31.68/ticket (distance class 2), €56.91/ticket (distance class 3); from May 2024: €15.53/ticket (distance class 1), €39.34/ticket (distance class 2) and €70.83/ticket (distance class 3)) together with the aforementioned emission factors and the estimated average flight distances imply (positive) CO2 prices of the tax increase of €29.55/t CO212, €22.27/t CO213 and €22.36/t CO214 according to the above-mentioned formula. A weighted average according to the share of distance classes in all flights (Federal Statistical Office, 2024) provides an average implicit CO215 price of €28.30/t CO216. on a weighted average. The increase in the aviation fuel tax does not therefore offset the undesirable incentives of the negative CO2 price of the aviation fuel exemption.
2.5 Conclusion and discussion
Climate-damaging subsidies mean implicit negative CO2 prices. An implicit negative CO2 price can be derived from the relationship between the direct reduction in revenue in the federal budget and the affected CO2 emissions. Depending on the subsidy, this may be a direct tax concession for the use of fossil fuels, such as diesel or aviation fuel. In the case of the commuting allowance or company car privilege, the tax structure indirectly induces higher emissions.
For some subsidies, the exact amount depends on the individual case, but despite the ranges, the amounts are considerable compared to the BEHG or the EU Emissions Trading System (ETS-1) relevant for aviation. Table 2 provides an overview of the results. It should be noted that the subsidy volumes and affected emissions shown there are not identical to the amount of financial leeway gained and the emission reduction realised in the event of abolition.
| Subsidy | Lost tax revenue | Affected CO2 emissions | Implicit CO2 price |
|---|---|---|---|
| Diesel privilege | €2.5 billion | 36 million tonnes | -€70/t CO2 |
| Commmuting allowance | €5–€6 billion | 30 million tonnes | -€200 to -€380/t CO2 |
| Company car privilege | €3.5–€5.5 billion | 8–12.8 million tonnes | -€160 to -€690/t CO2 |
| Tax concession for aviation fuel | €0.3–€0.6 billion | 2 million tonnes | -€130 to -€260/t CO2 |
| TOTAL | €11.3–€14.8 billion | 76–80.8 million tonnes | |
| Comparison: CO2 price – in the BEHG for 2024 – in the ETS-1 for 2022 | + €45/t CO2 + €81/t CO2 |
The distorting effect of the implicit negative CO2 prices related to the tax concessions considered here is in the range of -€70 to -€690/tCO2 – significantly higher than the CO2 price signal in the BEHG of €45/tCO2 in 2024. This shows that the historically evolved system of taxes and levies, including existing concessions, significantly favours the use of fossil fuels.
The implicit negative CO2 prices calculated here are based on an average analysis in which the calculated negative CO2 price reflects the average monetary benefit of all CO2 emissions affected by the subsidy. In contrast, the CO2 price in an emissions trading system, such as the EU ETS, which is determined by supply and demand, represents marginal costs (i.e. the additional costs incurred by the polluter as a result of emitting an additional tonne of CO2). However, the CO2 price under the BEHG is relevant for transport. The annual CO2 prices stipulated therein are set by law until the end of 2026 and represent fixed levies. The extent to which the politically negotiated BEHG fixed price for CO2 reflects the marginal cost is questionable, but marginal cost estimates for transport in the literature generally imply significantly higher optimal CO2 prices (Axsen et al. 2020). We therefore compare here an average implicit CO2 price with a politically determined CO2 price. We thus deviate from the usual economic understanding, which generally suggests a comparison based on marginal costs or marginal prices.
To approach a marginal cost comparison, we conclude with a greatly simplified calculation. For this purpose, the total amount of the subsidy can be compared with the emissions savings if the subsidy were abolished. However, in some cases, it is not clear whether and how a subsidy could be abolished. In addition, there are few studies on the CO2 reduction effect of abolishing a subsidy, their estimates are methodologically challenging and are often not presented transparently. We use the following estimates from UBA (2021) to illustrate the subsidies considered here: for the diesel privilege, 3.7Mt CO2 reduction with a subsidy volume of €2.5 billion; for the commuting allowance,17Since a landmark ruling by the Federal Constitutional Court (judgement of 9 December 2008 – 2 BvL 1/07), a broad legal literature has developed on the question of whether, and in what way, it is constitutionally possible to abolish the commuting allowance, which cannot be dealt with here as abolition is only discussed in theory. 2Mt CO2 reduction with a subsidy volume of €5–€6 billion; and for the company car privilege, 1.3–3.9Mt CO2 with a subsidy volume of €3.5–€5.5 billion. No corresponding figures are available for the tax concession for energy products used in domestic air traffic. The ratio of subsidy and CO2 reduction in the event of abolition results in approximate implicit negative marginal CO2 prices of: -€675/tCO2 for the diesel privilege, -€2,500 to -€3,000/tCO2 for the commuting allowance, and -€900 to -€4,200/tCO2 for the company car privilege. The marginal CO2 prices in the event of abolition would therefore be significantly higher than the average implicit negative CO2 prices analysed here in the main text.
3 Who benefits from the negative CO2 prices?
The implicit negative CO2 prices resulting from the climate-damaging subsidies in transport considered here favour all households that drive diesel vehicles, commute longer distances to work, have a company car or use domestic flights. The effects on income distribution are analysed below.
We analyse the distribution effects of negative CO2 prices on the basis of individual data from the 2020 Socio-Economic Panel (SOEP) survey18The Socio-Economic Panel (SOEP) is a representative longitudinal survey of households in Germany. The survey was launched in 1984 and covered 20,000 households with 35,000 people in the 2020 wave. In addition to income and other socio-economic characteristics, the SOEP collects detailed information at regular intervals on attitudes, time use, education, health and employment history, as well as energy consumption. and the 2017 Mobility in Germany (MiD) survey.19Mobility in Germany (MiD) is a nationwide survey of 155,000 households, or 315,000 people, on their everyday transport behaviour. To do this, we simulate the direct income effects of the tax privileges or provide indications of their effects, and look at the relative income effects in relation to disposable income. The results are analysed by deciles of equivalence-weighted net household income.20To make the income situation of households of different sizes and compositions comparable, a needs-weighted per capita net income (equivalised income) is calculated from the net household income for the household members according to the standard international needs scale (“new OECD scale”). The population is then categorised into ten equal groups (deciles) according to this level of income. The net household income is the sum of all income of the household members: earned income and property income, pensions, income replacement benefits, child benefit, basic income support, housing benefit, child supplement, maintenance allowance and private maintenance payments, less income tax and social security contributions. Other economic effects are neglected, as are the effects of using additional revenue from a reduction in subsidies for compensatory measures – such as a reduction in vehicle tax for diesel vehicles, reductions in income tax and social security contributions, or higher transfer payments (in particular through climate dividende).
3.1 Energy tax concession for diesel fuel
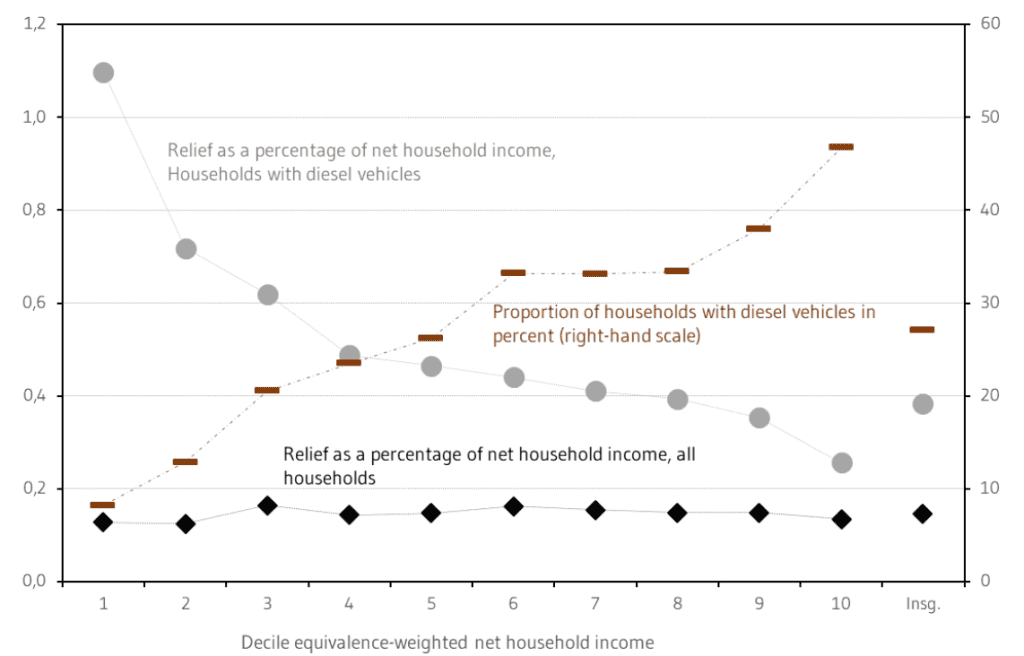
According to the SOEP survey from 2020, 27% of private households in Germany had at least one diesel car (Figure 2), totalling 11 million vehicles.21The 1.5 to 2 million diesel company cars that employees can use privately are presumably not included. The fuel costs for private use should also not be included, as these are usually covered by the company. Ownership increases significantly for higher incomes. In the lower two income deciles, only a few households have a diesel car, in middle-income groups, a quarter have a diesel vehicle, and in the higher income groups, it is a third. In the top decile, almost every second household has a diesel car.
Diesel vehicles and consumption 2019/2020. Net household income 2019, extrapolated to 2024. Equivalence-weighting of net household income with the new OECD scale.
Source: Microsimulation analyses with the Socio-economic panel (SOEP) 2020, v37.
The diesel privilege has only a moderate impact on the overall distribution of income. Overall, private households are relieved of around €2.5 billion per year, assuming constant use; including VAT, this amounts to €3.0 billion. This is equivalent to an average of 0.15% of net income across all households in 2024. This average relief is largely proportional across the income deciles.
However, this conceals major differences among those affected. The few diesel drivers in the lower income groups receive significantly more relief as a proportion of their income than the many higher earning diesel drivers. In the middle to higher income groups – from the fourth to the eighth income decile – the income effects for those affected are still noticeable, at 0.5% to 0.4%. In the top decile, they account for only 0.26% of net income.
Although the effects of the diesel privilege are moderate in macroeconomic terms, they are certainly noticeable among those affected, especially in the middle- and higher-income groups, where a third of all households drive a diesel vehicle.
3.2 Commuting allowance
We simulate the distribution effects of the abolition of the commuting allowance using the Tax-Benefit Microsimulation Model (STSM) from DIW Berlin, which is based on the SOEP survey for 2020 (for model documentation, see Steiner et al. 2012). The incomes are extrapolated to the year 2024, with the employee allowance for income-related expenses of €1,230, according to statutory tax law in 2024, held constant.
According to the SOEP survey, just under 18% of private households in Germany had commuters travelling more than 20 km to work (one-way distance to the workplace) (Figure 3). This proportion is low in the lower income groups, rising significantly to 35% in the top income decile.
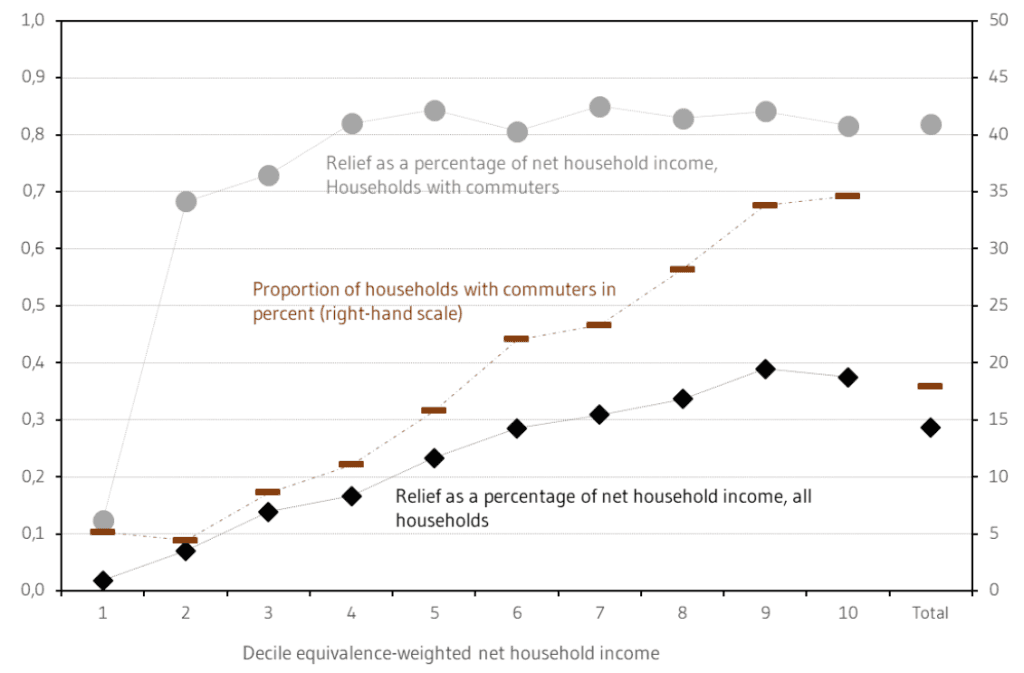
Households with commuters: One or more employed persons living more than 20 km from their workplace. Net household income 2019, extrapolated to 2024. Needs-weighting of net household income using the new OECD scale.
Source: Microsimulation analyses with the Socio-economic panel (SOEP) 2020, v37.
According to the simulation calculation, the commuting allowance will reduce the burden on private households by €5.3 billion in 2024, or an average of 0.3% of net income. In relation to all households, it is primarily middle- and higher-income groups that will benefit. There are fewer people in employment in the lower income deciles, and those with lower incomes usually have shorter commutes to work. Furthermore, the relief effect of the commuting allowance depends on the individual marginal tax rate, which is lower for lower incomes. Overall, the relief provided by the commuting allowance increases significantly with rising income. The relative relief effect is slightly reduced in the top decile, mainly due to the high incomes in this group.
For the commuters within these households, however, the relief effects are disproportionately higher at a good 0.8% of net income. These are fairly constant in the middle- and higher-income groups. Middle-income earners benefit less in absolute terms from the commuting allowance due to shorter distances to work and lower marginal tax rates. However, this is compensated for in the relative income effects by their lower net incomes.
Overall, the extreme case of a complete abolition of the commuting allowance would increase tax progression for middle and higher incomes, while high incomes would be burdened relatively less. The commuters affected in the middle- to higher-income groups would be burdened by a good 0.8% of their net income. If they frequently drive a diesel, they would also be affected by a possible abolition of the diesel privilege, resulting in a cumulative burden of around 1.3% of net income. This raises the question of how reforms with accompanying compensation measures can be gradually designed (see Section 4).
3.3 Company car privilege
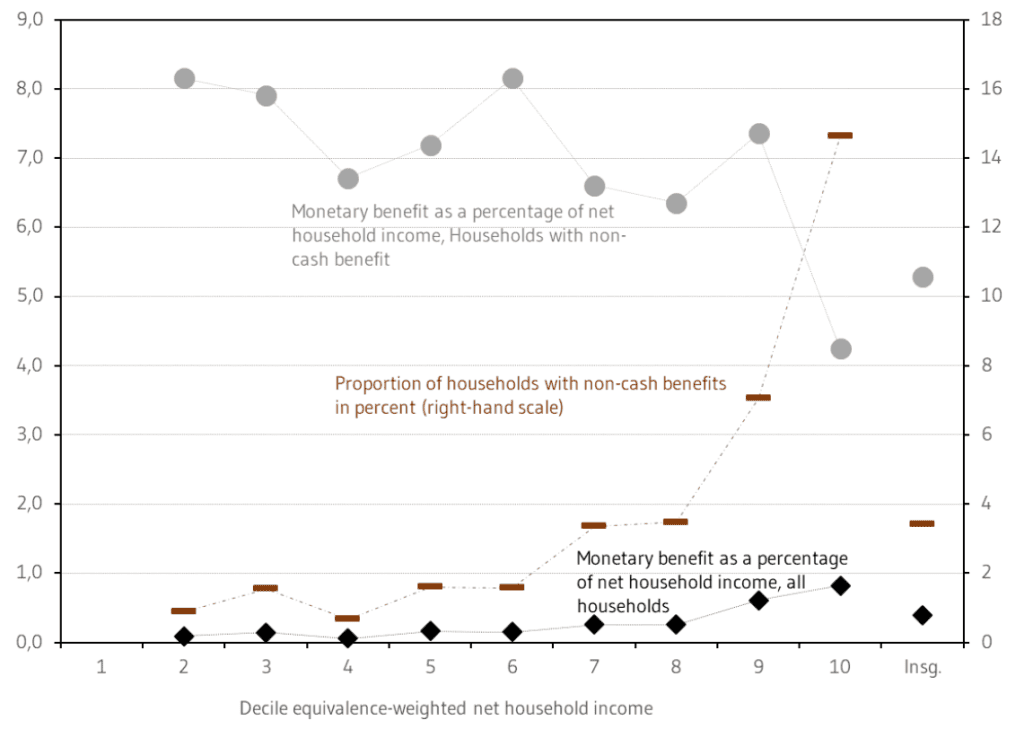
The use of company cars, and the associated non-cash benefit, is regularly surveyed in the SOEP. The 2020 survey is used here. There is presumably major underreporting here, as many respondents do not specify company car use in the survey.22In the 2020 survey, an extrapolated 1.8 million people stated that they used a company car privately, while 1.4 million people declared a non-cash benefit. This is significantly lower than would be expected according to the statistics cited above (Section 2.3). There is probably a major underreporting here, as many respondents did not indicate company car use in the survey. Furthermore, households with very high incomes tend to be underreported in the SOEP, but this is likely to be immaterial to the total number of cases. In contrast, the information provided by the respondents on the amount of the non-cash benefit appears plausible, ranging from €300 to €400 per month in the middle- and higher-income groups. In the top two income deciles, average monetary benefits of €500 to €600 per month are stated. As the underreporting of the actual cost of private use is also unclear, we refrain from a detailed simulation of the tax effects of company car privilege.
However, as in the previous figures, Figure 4 shows the proportion of households with non-cash benefits and their significance in relation to net household income. As there are only a few cases for the first decile, some of which contain implausible data, we have excluded these from our analysis.
Needs weighting of net household income using the new OECD scale.
Source: Microsimulation analyses with the Socio-economic panel (SOEP) 2020, v37.
Of all households, 3.4% reported a non-cash benefit. Up to the sixth income decile, the proportion of households with a non-cash benefit is less than 2%. In the seventh and eighth deciles, the proportion rises to 3.5%. In the ninth decile, the proportion rises to 7% and in the top decile to 15%. Accordingly, the significance of imputed income for the overall income distribution is low; it only accounts for a noticeable proportion of income in the top two income deciles.
For company car users, however, the non-cash benefit accounts for a significantly larger proportion of household income. This applies, in particular, to the few cases with low and medium incomes, where the non-cash benefit accounts for 6% to 8% of net income. Due to the significantly higher benefit per vehicle, the share of the non-cash benefit rises to over 7% for users in the ninth decile, while it falls to 4% in the top decile because of their very high incomes.
If the taxable non-cash benefits were to increase significantly as a result of a reform, the income tax burden would rise in line with the marginal tax rates. If we assume, for the sake of simplicity and as an upper scenario, that the non-cash benefits double across the board, the tax burden distribution would become more progressive, as high-income earners, who usually have high marginal tax rates, would be particularly affected. At the same time, however, the few company car users with a medium income would also be significantly affected. With their marginal tax rates of around 25%, for the most part, this would result in an additional burden of around 1.8% of net income. In the ninth decile, the additional burden for those affected would rise to over 2.5%, while in the top income decile, marginal tax rates would only rise slightly and the burden would fall in view of their high incomes.
Overall, it can therefore be seen that the privileges in company car taxation primarily favour households with high incomes. In the few cases with lower or medium incomes, only a few employees have a company car. In these cases – such as employees or the self-employed in field service, care or logistics – the non-cash benefits make up a certain proportion of household income. Therefore, even with their lower marginal tax rates, higher taxation would mean a noticeable additional burden. Several studies come to very similar conclusions (see FiFo 2012 or FÖS 2023b). FiFo (2012) also argues that the current flat-rate taxation of company cars violates horizontal tax justice (i.e. economically equal things are not taxed equally), and that it is also “unnecessarily hostile to performance and growth” (FiFo 2012).
3.4 Tax concession for aviation fuel
The relief effect of the tax concession for aviation fuel cannot be estimated on the basis of the SOEP due to a lack of suitable variables. However, the “Mobility in Germany 2017” survey can be used to calculate the average number of domestic German flights per household, by deciles of equivalised net household income. Based on this, it is also possible to approximate the relative relief effect of the tax exemption in comparison to net household income (Figure 5). Due to a small sample size and some implausible data, the first decile is excluded from the analysis.

The average values correspond to the weighted averages of the deciles.
Needs-weighting of net household income using the new OECD scale.
Source: Calculations based on the survey “Mobility in Germany 2017”.
Overall, around 4% of households use domestic flights. Households with higher incomes fly significantly more frequently on average. Assuming an average flight distance of 500 km, and paraffin consumption of 0.0358 litres per person-kilometre, this results in a low average reduction of 0.01% of monthly income for the economy as a whole. The low level of relief in all deciles can be explained by the small number of households and flights affected. The relative relief among affected households is higher, at 0.31% of net household income. The relative relief effect of the aviation fuel exemption decreases as income increases.
The fluctuations across deciles can presumably be explained by the small sample size. Estimating the total subsidy volume requires data and calculations that go beyond these initial approximations.
4 Reform options
In order to strengthen the role of CO2 pricing in the mix of instruments for achieving climate protection targets, distorting subsidies should be reduced as far as possible, or restructured in a climate-friendly way. The inconsistent, widely varying negative price signals from subsidies significantly hinder the effectiveness of CO2 pricing through the BEHG and EU ETS. This results in a lower reduction in emissions at higher abatement costs because the subsidies prevent abatement opportunities from being realised. If the CO2 price in the BEHG is to be freely determined from 2027, the subsidies will lead to higher CO2 prices in the ETS (van den Bergh et al. 2021), although the strength of the effect is uncertain.
There is a great variety of possible reform options for the subsidies analysed here, and their effect in individual cases is complex and highly dependent on regulatory details. Nevertheless, basic economic mechanisms can be used to provide guidelines for a possible prioritisation of reform measures over time. We therefore conclude by discussing known reform options, and use our analyses and the scientific literature to rank them according to two criteria: their emission reduction potential (scope and time horizon) and their distribution effect, to provide political decisionmakers with an initial orientation for prioritising reform measures. Table 3 summarises the classification of the reform potential discussed below based on the two evaluation criteria.
| CO2 reduction potential | Distribution effect | Reform options | ||
|---|---|---|---|---|
| Time horizon & Scope | Mechanism | Relative to status quo | ||
| Diesel privilege | Short-term: High Medium-term: Medium | 1. Diesel drivers react immediately to price increases by reducing consumption 2. Medium-term incentive to switch to e-cars | Approx. 14.4 million diesel cars Moderate overall economic impact, but noticeable relief for middle-income earners | (Gradual) abolition and compensation, e.g. vehicle tax reduction, climate money or swap premium; toll compensation for lorries |
| Commuting allowance | Long-term: Medium | Reduced commuting distances and changed choice of transport due to change of residence and place of work | 18 million taxpayers use this Commuters with medium to higher incomes benefit the most | Reduction of eligibility and restriction to hardship cases, conversion to mobility allowance |
| Company car privilege | Short-term: Low Medium-term: Medium | 1. Fewer private car journeys 2. Steering people towards economical/electric new cars 3. Lower emission intensity in the used car market | Approx. 3.5 million company cars in Germany High-income households particularly benefit | Increase in the flat-rate value and/or differentiation of the taxable non-cash benefit according to CO2 emissions |
| Tax concession for aviation fuel | Short-term: Low | Air travellers react to flight prices, but emissions from domestic flights are low | Households with higher incomes take significantly more domestic flights | Better to strengthen the EU ETS or the EU Energy Tax Directive |
options of subsidies
4.1 Energy tax concession for diesel fuel
A large number of environmental organisations, scientists and think tanks are in favour of abolishing the diesel privilege (see Agora Verkehrswende, 2018; Edenhofer & Flachsland, 2018; FÖS, 2022). A common reform approach involves adjusting the energy tax on diesel fuel based on its energy content, as with petrol. This would mean an increase in the tax from just under €0.47 to €0.76 per litre (see FÖS, 2023; UBA, 2021a). The abolition would therefore make diesel around €0.35 more expensive per litre at the pump, including VAT. The tax rate could be adjusted gradually. To prevent lorries from being excessively burdened by the adjustment to the tax on diesel fuel, in addition to the HGV toll, affected vehicles would either have to be reimbursed for the increased fuel costs or be compensated by an adjustment of the toll (FÖS 2023).
Abolishing the diesel privilege already has significant reduction potential in the short term. The empirical literature shows that diesel drivers react much more sensitively to energy price increases than is often assumed (Zimmer and Koch 2017, Gillingham and Munk 2019, Grigolon et al. 2018). Estimates for Germany suggest that abolishing the diesel privilege could achieve CO2 reductions of around 10% (Zimmer/Koch 2017). At the same time, empirical studies show that higher fuel prices make the purchase of electric vehicles more attractive in the medium term (Bushnell et al. 2022). Such additional incentives for electric cars seem attractive, given the discontinuation of the previously significant electric car purchase premiums. As compensation for the additional burden, it would be conceivable to flank the abolition of the diesel privilege with a reduction in vehicle tax for diesel vehicles. An exchange premium for scrapping an old diesel car to buy an electric car could be an alternative compensation measure that would additionally incentivise the switch to e-mobility (Koch et al. 2019; Nistad et al. 2020).
4.2 Communting allowance
Approaches in the literature to reforming the commuting allowance include: (1) a complete abolition, (2) an abolition with the introduction of a hardship rule (deduction of actual costs as extraordinary expenses in accordance with Section 33 EstG), (3) the introduction of a mobility allowance (€0.875/km deduction from tax liability, min. €150, max. €1,500, possibly only if there are objectively poor public transport connections) (Bach et al. 2019, UBA 2022). A conversion into a mobility bonus, in particular, would avoid the progressive relief effect of the current commuting allowance in favour of wealthy households. The Federal Environment Agency (2022) has analysed the effects for the year 2030 of several reform proposals compared to the status quo. The impact on the federal budget and possible CO2 reductions depend heavily on the chosen reform and, depending on the design, is in the range of €0–€9 billion in additional tax revenue compared to the status quo, as well as a saving of 0.5–4.6Mt CO2 per year.
A reorganisation of the commuting allowance can contribute to reducing emissions, especially in the long term. Empirical studies show that the commuting allowance provides effective incentives for employees to accept jobs that are further away from their place of residence (Boehm 2013). There is also evidence that commuting distances, and thus transport emissions, increase as a result (Paetzold 2019). At the same time, efficiency effects on the labour market must also be taken into account. This argues in favour of recognising higher commuting costs or double households in taxation, at least in the short and medium term following a change of job.
In fact, changes in the choice of place of work and residence, and the choice of car or other means of transport, will only take place in the medium to long term (Borck/Wrede 2009). It is therefore unlikely that a reform of the commuting allowance will make a significant contribution to reducing emissions in the next few years. Short-term effects would result from the increase in working remotely, which can now be recognised as income-related expenses for tax purposes.
4.3 Company car privilege
There is consensus in the literature that the taxable non-cash benefit is generally lower than the real non-cash benefit. This encourages the ownership of additional and high-consumption cars, with high-income households benefiting in particular. The reform proposals and discussions in the literature therefore focus on three aspects:
- Increase the flat-rate taxation of combustion company cars to the realistic value.
- Stronger incentives for low-emission company cars (by staggering the taxable non-cash benefit according to the car’s CO2 emissions).
- Greater distributive justice in the organisation.
Increasing the flat-rate taxation for company cars with internal combustion engines would be a relatively easy reform to implement, with significant additional tax revenue, while at the same time reducing the attractiveness of a company car with an internal combustion engine. According to Harding (2014) and various case studies, the non-cash benefit of private use is on average approx. 2.0–2.5 times higher than with the current 1% rule, so that a flat-rate tax of 2.0–2.5% of the list price per month (or 24%–30% per year) would correspond to the non-cash benefit of private use. Many European countries already have correspondingly higher flat-rate taxation than Germany. For example, the monthly values for company cars with internal combustion engines are around 2% in Denmark and the Netherlands (and even higher for very high CO2 emitters) and 2.5%–3.0% in the United Kingdom (see ACEA 2022).
Empirical studies show that the environmental effects of the flat-rate taxation of privately used company cars also result from the fact that users drive more expensive and more fuel-intensive cars than they would without tax concessions (Gutiérrez-i-Puigarnau and Van Ommeren 2011). Therefore, the medium-term emission potential of a reform of company car privilege lies primarily in steering employees towards low-consumption or emission-free vehicles. Possible starting points for such a steering effect are a differentiation of the monetary benefit between efficient and inefficient combustion cars, and between combustion and electric vehicles, or the introduction of a price cap for combustion cars, as already exists for electric vehicles. A differentiation according to CO2 emissions already exists in several European countries, such as Belgium and the United Kingdom, and there is an explicit differentiation between electric cars and combustion cars in the Netherlands and Luxembourg (see ACEA (2022) and FÖS (2023) for an overview of various countries). For electric cars, the tax level increases from a vehicle price of €60,000 under current regulations. Similar price limits for combustion engines could mitigate the distribution effect of the current company car privilege in favour of richer households (FÖS 2023). However, an initial empirical study on “green” incentives in company car privilege in the Netherlands shows that policies that incentivise the purchase price directly are more effective in steering consumers towards electric vehicles (Dimitropoulos et al. 2016). Staggering the taxable non-cash benefit according to CO2 emissions would have greater environmental effects in the medium to long term, as lower-CO2 company cars and, in particular, more electric company cars would enter the used car market.
A much more precise taxation of private company car use should enable the recording of private mileage on the basis of telematics or GPS technology in the medium to long term. This will also significantly reduce the bureaucratic burden of mandatory electronic logbooks.
4.4 Tax concession for aviation fuel
A tax concession for energy products used in domestic air traffic has little potential to reduce emissions. This is primarily due to the fact that only 0.1% (as of 2022) of total German CO2 emissions are attributable to domestic air traffic (UBA, 2023).
At the same time, however, empirical studies show that taxing aviation fuel would reduce demand for flights, as air travellers are price-sensitive (Brons et al., 2002). Demand for flights decreases when prices rise, particularly on short routes where rail travel is a realistic alternative (Fageda and Teixidó, 2022, Kang et al., 2022). Evidence for the integration of air traffic into the European emissions trading scheme, which made flight tickets more expensive, suggests that short-haul flights fell by around 9%, and emissions fell by around 11% (Fageda and Teixidó, 2022). Nationally levied ticket taxes reduce the number of flights and emissions in a similar way (Bernardo et al., 2024).
Overall, the empirical evidence therefore implies that stronger price signals in air traffic have the potential to substantially reduce emissions. Due to the low emissions base of domestic flights, and the possible effects of evasive refuelling in other European countries, the potential lies above all in EU-wide or international pricing of avation fuel. This can be achieved, on the one hand, by strengthening European emissions trading for aviation and, on the other hand, by amending the EU Energy Tax Directive. However, a reform of the Energy Tax Directive has not yet been implemented in the “Fit for 55” package (EU COM/2021/563, 2021).
4.5 Role of social compensation
The recent farmers’ protests demonstrate the importance a forward-looking policy process and good policy design for subsidy reduction projects. Plannability, a gradual reduction, and clearly defined and communicated compensation measures can make a significant contribution to ensuring that affected population groups are included in the reform. The effects of possible reforms vary depending on their design, and across and within income groups, depending for example on transport links and the existing infrastructure. This emphasises the urgency of social cushioning through redistribution mechanisms, such as climate dividend (see Kalkuhl et al., 2022, Schrems et al., 2022). The reimbursement of revenues from the CO2 price can help to alleviate social hardship and, at the same time, strengthen social acceptance (cf. Kalkuhl et al., 2021). It should also be emphasised that climate dividend can only be one part of a comprehensive, socially balanced relief. A polluter pays pricing of transport can only be successful through the interplay of measures such as the expansion of alternative transport options and a socially acceptable design.
The authors would like to thank Mark Hamburg and Joris Pieper (DIW Berlin) for their valuable research assistance.
This Ariadne dossier was prepared by the above-mentioned authors of the Ariadne consortium. It does not necessarily reflect the opinion of the entire Ariadne consortium or the funding agency. The content of the Ariadne publications is produced in the project independently of the Federal Ministry of Education and Research.
Literature
ACEA (2022): ACEA Tax Guide 2022. Abrufbar unter: https://www.acea.auto/files/ACEA_Tax_Guide_2022.pdf
Agora Verkehrswende (2018): CO2 -Minderung bei Pkw – die Rolle der Steuerpolitik. Ein europäischer Vergleich. https://www.agora-verkehrswende.de/fileadmin/Projekte/2018/Fiskalische_Instrumente/14_Fiskalische-Instrumente_WEB.pdf
Agora Verkehrswende (2021): Dienstwagen auf Abwegen – Warum die aktuellen steuerlichen Regelungen einen sozial gerechten Klimaschutz im Pkw-Verkehr ausbremsen. Oktober 2021.
Agora Verkehrswende (2022): Steuersignale zur Transformation der Pkw-Flotte. Reformoptionen für eine faire und klimagerechte Kfz- und Dienstwagenbesteuerung. Oktober 2022.
Axsen, J., Plötz, P., & Wolinetz, M. (2020). Crafting strong, integrated policy mixes for deep CO2 mitigation in road transport. Nature Climate Change, 10(9), 809-818.
Azar, C., Johansson, D. (2012): Valuing the non-CO2 climate impacts of aviation. https://link.springer.com/article/10.1007/s10584-011-0168-8
Bernardo, Valeria, Xavier Fageda, und Jordi Teixidó. 2024. „Flight ticket taxes in Europe: Environmental and economic impact“. Transportation Research Part A: Policy and Practice 179: 103892.
Bach, Stefan, Uwe Kunert, Sabine Radke, Niklas Isaak (2019): CO2-Bepreisung für den Verkehrssektor? Bedeutung und Entwicklung der Kosten räumlicher Mobilität der privaten Haushalte bei ausgewählten verkehrspolitischen Instrumenten. Studie im Auftrag der Stiftung Arbeit und Umwelt der IG BCE. https://www.arbeit-umwelt.de/wp-content/uploads/190705_Studie_CO2-SteuerVerkehr_DIW_StiftungIGBCE.pdf.
BMDV (2023): Verkehr in Zahlen 2022/23. https://bmdv.bund.de/SharedDocs/DE/Publikationen/G/verkehr-in-zahlen-2022-2023-pdf.pdf?__blob=publicationFile
BMF (2023): 29. Subventionsbericht der Bundesregierung. https://www.bundesfinanzministerium.de/Content/DE/Downloads/Broschueren_Bestellservice/29-subventionsbericht.pdf?__blob=publicationFile&v=13
Boehm, M. J. (2013). Concentration versus re-matching? Evidence about the locational effects of commuting costs. LSE Centre for Economic Performance Discussion Paper, 1207
Börjesson, M., & Roberts, C. (2023). The impact of company cars on car ownership. Transportation Research Part A: Policy and Practice, 176, 103803.
Borck, R., & Wrede, M. (2009). Subsidies for intracity and intercity commuting. Journal of Urban Economics, 66(1), 25-32.
Brons, Martijn, Eric Pels, Peter Nijkamp, und Piet Rietveld. 2002. „Price elasticities of demand for passenger air travel: a meta-analysis“. Journal of Air Transport Management 8 (3): 165–75.
Bundesrechnungshof (2022): Bericht nach § 88 Absatz 2 BHO an den Finanzausschuss des Deutschen
Bundestages zum Steuervollzug bei der Entfernungspauschale. Hinweise zu dem Regierungsentwurf eines Steuerentlastungsgesetzes 2022. Wiesbaden. Online verfügbar unter https://www.bundesrechnungshof.de/SharedDocs/Downloads/DE/Berichte/2022/steuervollzug-entfernungspauschale-volltext.pdf?__blob=publicationFile&v=1 , zuletzt geprüft am 21.12.2023.
Bundesrechnungshof (2022): Bericht nach § 88 Absatz 2 BHO an den Finanzausschuss des Deutschen Bundestages zum Steuervollzug bei der Entfernungspauschale. Hinweise zu dem Regierungsentwurf eines Steuerentlastungsgesetzes 2022. Wiesbaden. Online verfügbar unter https://www.bundesrechnungshof.de/SharedDocs/Downloads/DE/Berichte/2022/steuervollzug-entfernungspauschale-volltext.pdf?__blob=publicationFile&v=1 , zuletzt geprüft am 21.12.2023.
Bundesregierung (2022): Antwort auf die Kleine Anfrage der Abgeordneten Christian Görke, Dr. Gesine Lötzsch, Klaus Ernst, weiterer Abgeordneter und der Fraktion DIE LINKE – Drucksache 20/1114 – Nutzen der Pendlerpauschale, 14.04.2022. Online https://dserver.bundestag.de/btd/20/014/2001441.pdf.
Bundesregierung (2023): 29. Subventionsbericht der Bundesregierung
Burger, A. und Bretschneider, W./ UBA (2021): Umweltschädliche Subventionen in Deutschland. https://www.umweltbundesamt.de/sites/default/files/medien/479/publikationen/texte_143-2021_umweltschaedliche_subventionen.pdf
Bushnell, J. B., Muehlegger, E., & Rapson, D. S. (2022). Energy prices and electric vehicle adoption. NBER WP, w29842.
Deutscher Bundestag (2024). Gesetzentwurf der Fraktionen SPD, BÜNDNIS 90/DIE GRÜNEN und FDP – Entwurf eines Zweiten Haushaltsfinanzierungsgesetzes 2024. Drucksache 20/9999.
Dimitropoulos, A., van Ommeren, J. N., Koster, P., & Rietveld, P. (2016). Not fully charged: Welfare effects of tax incentives for employer-provided electric cars. Journal of Environmental Economics and Management, 78, 1-19.
Edenhofer, O. & Flachsland, C. (2018). Eckpunkte einer CO2-Preisreform für Deutschland. MCC working paper 01/2018. https://www.pik-potsdam.de/en/news/latest-news/archive/files/eckpunkte-einer-co2-preisreform-fur-deutschland
Energiesteuergesetz (EnergieStG). https://www.gesetze-im-internet.de/energiestg/__2.html
EnergieStG https://www.gesetze-im-internet.de/energiestg/index.html#BJNR153410006BJNE000307360
Energy LuftVStG https://www.gesetze-im-internet.de/luftvstg/index.html#BJNR188510010BJNE001204123
EU COM/2021/563 (2021). Proposal for a Council Directive restructuring the Union framework for the taxation of energy products and electricity (recast) https://eur-lex.europä.eu/legal-content/EN/TXT/?uri=CELEX%3A52021PC0563
Europäische Kommission https://taxation-customs.ec.europä.eu/taxation-1/excise-duties/excise-duty-energy_en
Faber, J., O‘Leary, A./ CE Delft (2018): Taxing aviation fuels in the EU. https://www.transportenvironment.org/wp-content/uploads/2021/07/2019_02_CE_Delft_Taxing_Aviation_Fuels_EU.pdf
Fageda, Xavier, und Jordi J. Teixidó. 2022. „Pricing carbon in the aviation sector: Evidence from the European emissions trading system“. Journal of Environmental Economics and Management 111: 102591.
FIFO (Finanzwissenschaftliches Forschungsinstitut an der Universität zu Köln) (2011): Steuerliche Behandlung von Firmenwagen in Deutschland. Forschungskooperation des FiFo Köln mit Prof. Dr. jur. Stefan Klinski (Berlin) und dem Forum Ökologisch-Soziale Marktwirtschaft e.V. (Berlin). https://foes.de/pdf/2011_Firmenwagenbesteuerung_lang.pdf
FIFO (Finanzwissenschaftliches Forschungsinstitut an der Universität zu Köln) (2012): Reform der Besteuerung von privat genutzten Dienstwagen. Stellungnahme anlässlich des öffentlichen Fachgesprächs des Finanzausschusses des Deutschen Bundestages zu dem Antrag der Fraktion BÜNDNIS90/DIE GRÜNEN „Dienstwagenprivileg abbauen und die Besteuerung CO2-effizient ausrichten“ – Drucksache 17/8462 – sowie zu dem Antrag der Fraktion DIE LINKE „Wirksame Anreize für klimafreundliche Firmenwagen“ – Drucksache 17/9149 – am 7. November 2012 im Deutschen Bundestag. https://www.researchgate.net/profile/Michael-Thoene/publication/264956154_Stellungnahme_Reform_der_Besteuerung_von_privat_genutzten_Dienstwagen/links/53f75baf0cf2823e5bd6479f/Stellungnahme-Reform-der-Besteuerung-von-privat-genutzten-Dienstwagen.pdf
Forum Ökologisch-Soziale Marktwirtschaft (FÖS) (2021a): Zehn klimaschädliche Subventionen sozial gerecht abbauen – ein Zeitplan. https://www.greenpeace.de/publikationen/studie_klimaschaedliche_subventionen_sozial_gerecht_abbauen_feb_2021.pdf
FÖS (2021b): Klimaschädliche Subventionen abbauen, den Gordischen Knoten der Klimapolitik lösen. https://foes.de/publikationen/2021/2021-07_FOES_PolicyBrief-Subventionsabbau.pdf
Forum Ökologisch-Soziale Marktwirtschaft (FÖS) (2022): Zukunft der Energiesteuern auf Diesel, Erdgas, Strom & Co. https://foes.de/publikationen/2022/2022_03_FOES_Umsetzung_Energiesteuer_RL.pdf
Forum Ökologisch-Soziale Marktwirtschaft (FÖS) (2023a). Reform umweltschädlicher Subventionen: Auswirkungen auf Klima, Gesellschaft und Wirtschaft. https://foes.de/publikationen/2023/W_Reform_umweltschaedlicher_Subventionen.pdf
FÖS (Forum Ökologisch-Soziale Marktwirtschaft e. V.) (2023b): Das Dienstwagenprivileg. https://foes.de/publikationen/2023/2023-06_FOES_Subventionssteckbrief-Dienstwagenprivileg.pdf
Gillingham, K., & Munk-Nielsen, A. (2019). A tale of two tails: Commuting and the fuel price response in driving. Journal of Urban Economics, 109, 27-40.
Graver, B., Zhang, K., Rutherford D/ ICCT (2019): CO 2 emissions from commercial aviation, 2018. https://theicct.org/publication/co2-emissions-from-commercial-aviation-2018/
Grigolon, L., Reynaert, M., & Verboven, F. (2018). Consumer valuation of fuel costs and tax policy: Evidence from the European car market. American Economic Journal: Economic Policy, 10(3), 193-225.
Gutiérrez‐i‐Puigarnau, E., & Van Ommeren, J. N. (2011). Welfare Effects of Distortionary Fringe Benefits Taxation: The Case of Employer‐Provided Cars. International Economic Review, 52(4), 1105-1122.
Harding, M. (2014): Personal Tax Treatment of Company Cars and Commuting Expenses: Estimating the Fiscal and Environmental Costs.
Hebestreit, S. (2023): Pressemitteilung Nummer 280/23 vom 19. Dezember 2023. https://www.bundesregierung.de/resource/blob/975226/2250312/6fc279292e1cd7a71d62fa31d7aaf7bb/2023-12-19-haushalt-data.pdf?download=1
IPCC (2007): 2006 IPCC Guidelines for National Greenhouse Gas Inventories – Volume 2. Chapter 2: Stationary Combustion. https://www.ipcc-nggip.iges.or.jp/public/2006gl/vol2.html
IPCC (2019): 2006 IPCC Guidelines for National Greenhouse Gas Inventories – Volume 2. Chapter 3: Mobile Combustion. https://www.ipcc-nggip.iges.or.jp/public/2006gl/vol2.html
Kalkuhl, M., Knopf, B. & Edenhofer, O. (2021). CO2-Bepreisung: Mehr Klimaschutz mit mehr Gerechtigkeit. MCC-Arbeitspapier. https://www.mcc-berlin.net/fileadmin/data/C18_MCC_Publications/2021_MCC_Klimaschutz_mit_mehr_Gerechtigkeit.pdf
Kalkuhl, M., Kellner, M., Roolfs, C., Rütten, K., George, J., Bekk, A., Held, A. Heinemann, M., Eydam U., aus dem Moore, N., Pahle, M., Schwarz, A., Fahl, U., Blum, M., & Treichel, K. (2022). Optionen zur Verwendung der Einnahmen aus der CO2-Bepreisung. Kopernikus-Projekt Ariadne, Potsdam. https://ariadneprojekt.de/publikation/kurzdossier-optionen-zur-verwendung-der-einnahmen-aus-der-co2- bepreisung/
Kang, Yicheng, Sha Liao, Changmin Jiang, und Tiziana D’Alfonso. 2022. „Synthetic control methods for policy analysis: Evaluating the effect of the European Emission Trading System on aviation supply“. Transportation Research Part A: Policy and Practice 162: 236–52.
Koch, Nicolas, Nolan Ritter, Alexander Rohlf, Hannah Klauber, Andrea Nistad, Christian Bauer, und Chris Mutel. 2019. „Policies to enhance vehicle fleet modernization“. The Next Generation Policies Project Policy Brief No. 4. https://www.nextgenerationpolicy.com/fileadmin/user_upload/Fuss/Policy_Brief_No_4.pdf.
Laaser, Rosenschon, und Schrader (2023): Kieler Subventionsbericht 2023. Subventionen des Bundes in Zeiten von Ukrainekrieg und Energiekrise. Kiel: Kiel Institut für Weltwirtschaft – Leibniz Zentrum zur Erforschung globaler ökonomischer Herausforderungen (Kieler Beiträge zur Wirtschaftspolitik, Nr. 44 (Oktober 2023)), zuletzt geprüft am 21.12.2023.
Nistad, Andrea, Chris Mutel, Romain Sacchi, und Christian Bauer. o. J. „Vehicle retire-and-replace subsidy programs – The Life Cycle Perspective“. Paul Scherrer Institute. https://www.psi.ch/en/media/63266/download?attachment
OECD. 2015. „OECD Companion to the Inventory of Support Measures for Fossil Fuels 2015“. https://read.oecd-ilibrary.org/energy/oecd-companion-to-the-inventory-of-support-measures-for-fossil-fuels-2015_9789264239616-en.
OECD. 2023. “Effective Carbon Rates 2023: Pricing Greenhouse Gas Emissions through Taxes and Emissions Trading”, OECD Series on Carbon Pricing and Energy Taxation, OECD Publishing, Paris, https://doi.org/10.1787/b84d5b36-en.
Öko-Institut (2021): Möglichkeiten zur Regulierung der Klimawirkungen des Luftverkehrs. https://www.oeko.de/fileadmin/oekodoc/Moeglichkeiten-zur-Regulierung-der-Klimawirkungen-des-Luftverkehrs.pdf
Pache, E. (2005): Möglichkeiten der Einführung einer Kerosinsteuer auf innerdeutschen Flügen. https://www.umweltbundesamt.de/sites/default/files/medien/publikation/long/2853.pdf
Paetzold, J. (2019). Do commuting subsidies increase commuting distances? Evidence from a Regression Kink Design. Regional Science and Urban Economics, 75, 136-147.
Paetzold, Jörg; Winner, Hannes (2016): Taking the high road? Compliance with commuter tax allowances and the role of evasion spillovers. In: Journal of Public Economics 143, S. 1–14. DOI: 10.1016/j.jpubeco.2016.08.001.
Parry, Ian, Simon Black, und Nate Vernon. 2021. „Still Not Getting Energy Prices Right: A Global and Country Update of Fossil Fuel Subsidies“. https://www.imf.org/en/Publications/WP/Issues/2021/09/23/Still-Not-Getting-Energy-Prices-Right-A-Global-and-Country-Update-of-Fossil-Fuel-Subsidies-466004.
Paus (2023): Anwendung der 1 %-Regelung bei überwiegend privater Nutzung eines Kfz. Urteilskommentierung aus Haufe Finance Office Premium. Online https://www.haufe.de/finance/haufe-finance-office-premium/anwendung-der-1-regelung-bei-ueberwiegend-privater-nutzung-eines-kfz_idesk_PI20354_HI1211644.html
Richtlinie 2003/96/EC https://eur-lex.europä.eu/LexUriServ/LexUriServ.do?uri=CELEX:32003L0096:en:HTML
Statistisches Bundesamt (2024): 1,2 Milliarden € Luftverkehrsteuer im Jahr 2022 angemeldet. https://www.destatis.de/DE/Themen/Staat/Steuern/Weitere-Steuern/luftverkehrsteuer.html
Schrems, Isabel, Alex Auf der Maur, Andreas Kemmler, Tim Trachsel, Noha Saad, Stefan Bach, Jakob Knautz (2022): Wirkung des nationalen Brennstoffemissionshandels – Auswertungen und Analysen. Grundlagen für den ersten Erfahrungsbericht der Bundesregierung gemäß § 23 BEHG im Jahr 2022. Umweltbundesamt, CLIMATE CHANGE 45/2022. https://www.umweltbundesamt.de/sites/default/files/medien/1410/publikationen/2022-12-02_climate-change_45-2022_wirkung-nat-brennstoffemissionshandel.pdf
Steiner, Viktor; Wrohlich, Katharina; Haan, Peter; Geyer, Johannes (2012): Documentation of the tax-benefit microsimulation model STSM: Version 2012, DIW Data Documentation, No. 63, Deutsches Institut für Wirtschaftsforschung (DIW), Berlin
T&E (2021): Deutschlands Steuerpolitik für Dienstwagen. https://www.transportenvironment.org/wp-content/uploads/2021/08/TE-Briefing-Deutschlands-Steuerpolitik-fu%CC%88r-Dienstwagen-1.pdf
UBA (2019a): Schwerpunkt Fliegen. https://www.umweltbundesamt.de/publikationen/schwerpunkt-2-2019-fliegen
UBA (2019b): Wohin geht die Reise? https://www.umweltbundesamt.de/sites/default/files/medien/1410/publikationen/uba_fb_wohin-geht-die-reise.pdf
UBA (2021a). Mobilität neu steuern: Ein Steuer- und Abgabenkonzept für klimaschonenden und sozial gerechten Verkehr bis 2050. https://www.umweltbundesamt.de/sites/default/files/medien/479/publikationen/2022_fb_mobilitaet_neu_steuern_bf.pdf
UBA (2021b): Umweltschädliche Subventionen in Deutschland. https://www.umweltbundesamt.de/sites/default/files/medien/479/publikationen/texte_143-2021_umweltschaedliche_subventionen.pdf
UBA (2022a): CO2-Emissionsfaktoren für fossile Brennstoffe. https://www.umweltbundesamt.de/publikationen/co2-emissionsfaktoren-fuer-fossile-brennstoffe-0
UBA (Umweltbundesamt) (Hg.) (2022): Quantifizierung der Verteilungswirkungen der Entfernungspauschale. Berechnungen zur aktuellen sowie zu alternativen Ausgestaltungen. Sven Stöwhase und Alexander Altstadt. Umweltbundesamt, 30. September 2022. https://www.umweltbundesamt.de/sites/default/files/medien/366/dokumente/quantifizierungen_der_verteilungswirkungen_zur_entfernungspauschale.pdf
UBA (2023a). “Emissionsübersichten nach Sektoren des Bundesklimaschutzgesetzes 1990 – 2022”. Stand: 15.03.2023. https://www.umweltbundesamt.de/sites/default/files/medien/361/dokumente/2023_03_15_em_entwicklung_in_d_ksg-sektoren_pm.xlsx
UBA (2023): Klimawirkung des Luftverkehrs – Wissenschaftlicher Kenntnisstand, Entwicklungen und Maßnahmen. https://www.umweltbundesamt.de/publikationen/klimawirkung-des-luftverkehrs
UBA (2023): Verkehrsinfrastruktur und Fahrzeugbestand https://www.umweltbundesamt.de/daten/verkehr/verkehrsinfrastruktur-fahrzeugbestand#pkw-bestande-und-neuzulassungen-nach-kraftstoffart
van den Bergh, J. C. J. M., Castro, J., Drews, S., Exadaktylos, F., Foramitti, J., Klein, F., … & Savin, I. (2021). Designing an effective climate-policy mix: accounting for instrument synergy. Climate Policy, 21(6), 745-764.
Wissenschaftliche Dienste des Deutschen Bundestag (2020): Rechtliche Möglichkeiten zur Besteuerung von Flugbenzin in Deutschland. https://www.bundestag.de/resource/blob/653690/c217484733b97feb484ff7677d08f3da/WD-4-086-19-pdf-data.pdf
Wissenschaftlicher Dienst des Deutschen Bundestag (2023): Titel: Die Dienstwagenbesteuerung im Lichte des EU-Beihilferechts. https://www.bundestag.de/resource/blob/946978/921f15e92febbc155d783cf3f9a5b179/EU-6-017-23-pdf-data.pdf
WTO. 1994. „Agreement on Subsidies and Countervailing Measures“. https://www.wto.org/English/docs_e/legal_e/24-scm.pdf.
Zimmer, A., & Koch, N. (2017). Fuel consumption dynamics in Europe: Tax reform implications for air pollution and carbon emissions. Transportation Research Part A: Policy and Practice, 106, 22-50.
Zumkeller et al. (2006): Panelauswertung 2005 – Datenaufbereitung, Plausibilisierung, erste Auswertungen zu den Er-hebungen zur Alltagsmobilität 2004/06 sowie zu Fahrleistungen und Treibstoffverbräuchen 2005/07 für das Mobilitätspanel. Zwischenbericht, Projekt Nr. FE 70.0753 / 2004. https://mobilitaetspanel.ifv.kit.edu/downloads/Bericht_MOP_05_06.pdf