

Executive summary
Wind and solar generation requires large upfront investment but has very low running costs. As a result, the cost of clean electricity depends heavily on financing conditions, since lower borrowing costs translate directly into lower power costs. Low borrowing costs in turn require stable and predictable revenues, which volatile wholesale markets do not provide, and private markets cannot hedge price risk over the 25 to 35 year horizons that renewable projects require. For this reason, governments support renewables through long-term public contracts such as contracts-for-difference (CfDs). These contracts are usually treated as subsidies, but they serve a second function that is equally important: by reducing investors’ exposure to price risk, they make projects easier to finance and lower their cost of capital.
This analysis examines how the design of such contracts affects investor risk and, through it, the cost of financing renewables. It compares three contract families: two-sided CfDs, one-sided CfDs (Germany’s current “market premium”), and the recently proposed “financial CfD”. The comparison draws on a dataset of hourly, turbine-level output from 63 onshore wind parks in Germany over the period 2014 to 2023, and traces the effect of each contract through a project-finance model to the final cost of electricity. The sample is an existing fleet, to which we apply today’s costs. The results are informative about the ordering of contracts and the mechanisms behind it; the levels themselves should not be read as a cost forecast for new onshore wind.
Key findings
- Most of the benefit comes from risk reduction rather than subsidy. Long-term contracts both subsidize revenues and reduce risk, and the risk-reduction component is the larger of the two. For the best-performing designs, around 60 to 70% of the gap between market revenues and project costs is closed through lower financing costs rather than public payments. As a first-order estimate, each euro of subsidy is accompanied by 2.4 euros of lower financing costs and thus corresponds to around 3.4 euros of economic value.
- Whether a project has a contract matters more than which contract it has. Any well-designed long-term contract lowers the levelized cost of electricity by around 40 to 60 €/MWh, or about 30 to 45 percent, relative to selling on the market alone. The choice of contract type has a smaller effect, though it can still change the cost of electricity by up to 22 €/MWh, which remains material at system scale.
- Stable revenues and market integration are not in conflict. It is often assumed that protecting investors from price risk weakens their incentive to respond to market signals. The results suggest this depends on contract design rather than being unavoidable. Financial CfDs, which keep producers exposed to prices, can match or outperform conventional two-sided CfDs in reducing risk. Using an annual reference price and suspending support when prices turn negative can improve incentives and lower investor risk at the same time.
- Contract design can substitute for higher spending. Designs that leave the investor at the same level of profit differ by up to 22 €/MWh in what the public pays in subsidies. Improving contract design, rather than raising subsidy levels, can improve investment conditions and support the market integration of renewables. This becomes more relevant as the share of renewable generation rises.
1. Introduction
The vast majority of global power-generation investment today goes into wind and solar energy. These technologies have high upfront capital costs and low operating costs, so small changes in the cost of capital can substantially affect the levelized cost of electricity (LCOE) and the viability of a project. Yet low-cost financing requires stable and predictable revenues, which is at odds with the volatility of wholesale electricity prices and the stochastic nature of renewable generation.
To address this problem, governments across Europe have relied on policies that can be described as long-term public contracts, such as feed-in tariffs (FiTs) and contracts-for-difference (CfDs). While commonly discussed as subsidy instruments, these contracts also perform a second and equally important function: they hedge revenue risk. Revenue risk is the uncertainty in a project’s income, which arises both from the price at which output is sold and from the volume produced. By reducing exposure to future electricity-price volatility, long-term contracts improve the bankability of renewable projects and enable higher leverage ratios in their financing structures.
This financial mechanism is particularly important because long-term electricity-price risk cannot be efficiently hedged in private markets. Financial electricity products are typically traded only up to five years into the future, whereas renewable project finance must plan for investment horizons of 25 to 35 years. Public support contracts therefore substitute for missing long-duration hedging markets by reallocating price risk from investors to the public sector.
Revenue stabilization, however, may come at the cost of distorted operational and investment incentives. Under fixed-price support schemes such as FiTs or simple two-sided CfDs, generators may continue producing even during periods of negative wholesale prices, because their revenues are disconnected from market conditions. Similar distortions emerge in investment decisions. A solar installation optimized solely for production volume (facing south in the northern hemisphere) may receive the same per-unit remuneration as one better aligned with electricity demand (facing east or west). By removing price signals, highly protective contracts can therefore create welfare losses and inefficient capital allocation despite improving financing conditions.
Different contract structures provide different degrees of downside protection, upside retention, and exposure to spot prices, which implies different effects on both financing conditions and market incentives. Complexity might be a relevant factor too: a support scheme which lenders find hard to assess could be priced more conservatively. Recent literature frames renewable contract design as a trade-off between revenue stabilization and efficient market integration. Schlecht et al. (2024) have proposed a “financial CfD” that aims to resolve the trade-off by keeping producers exposed to market prices, but they did not assess its de-risking performance. That is the empirical question this report addresses.
The analysis uses real operational data rather than weather simulations. We draw on a unique dataset from a major German operator, covering hourly electricity production (both realized and potential) from more than 60 onshore wind parks. This matters because, as practitioners often argue, real-world production restrictions (wildlife protection, shadow and noise limits near settlements, localized grid bottlenecks, or turbine downtime) render simulated data unreliable when it comes to risk profiles, since they might correlate systematically with price patterns. These frictions are included in our revenue analysis, so the comparison of contracts reflects the risk profiles that real wind projects actually face.
Sections 4.1 and 4.2 focus on cash-flow risk, the year-to-year variation in revenues minus operating costs, rather than on the level of revenue; Sections 4.3 and 4.4 then turn to the level of support. Our findings show that well-designed financial CfDs reduce cash-flow risk more than current one-sided designs and, depending on the specification, can outperform the standard two-sided CfD as well. The commonly assumed trade-off between revenue stabilization and market integration can therefore be resolved through contract design. For two-sided CfDs, adding the rule that generators may not get compensation during negative hours does not increase their risk exposure, because those hours fell mostly in windy periods; Section 5 discusses whether this holds as they become more frequent.
2. Background: revenue risk and contract design
2.1 Why revenue risk matters for renewable financing
High cash-flow volatility reduces the internal funds available to a firm and, at the same time, its access to external financing, raising borrowing costs and the likelihood of financial distress (Li et al., 2023). Several empirical finance studies support this link between volatility and credit spreads, often using the coefficient of variation (CoV) of annual revenues as a normalized measure of cash-flow volatility (Augustin et al., 2025; Minton et al., 2002; Minton & Schrand, 1999; Molina Manzano, 2005; Tang & Yan, 2010). At the same time, project-finance practice and credit-risk models emphasize downside risk rather than symmetric variability, since defaults and covenant breaches are triggered by low-cash-flow states rather than by high volatility as such. This report uses both lenses: the coefficient of variation to summarize overall risk, and a project-finance model focused on the worst annual outcome to capture downside risk.
Wind projects are capital-intensive, which makes them highly sensitive to fluctuations in cash flows. For projects operating in the market, three sources of uncertainty affect the stability of these cash flows: market (price) risk, weather-related (volume) risk, and grid-related curtailment (volume) risk (Gatzert & Kosub, 2016). Public support schemes primarily target price and curtailment risk, leaving weather-driven volume risk largely unmanaged; but they also introduce risks of their own, such as volume risk in contracts where support is suspended in negative-price hours.
2.2 The three contract families
Against a merchant benchmark (a generator with no long-term contract, selling all its output in the day-ahead auction), we consider three families of long-term public contract. Formal definitions are given in Appendix A.1.
Two-sided CfD
Introduced in the UK electricity-market reform of 2014, a two-sided CfD tops up market income by comparing a reference price to a pre-agreed strike price. The government pays the generator when the reference price falls below the strike, and the generator pays the government when it exceeds the strike. Where the reference is the spot price of the same settlement period, this removes price risk entirely. Its weakness is the classic “produce-and-forget” incentive: with a fixed price, the investor is rewarded for volume regardless of when, and therefore how valuably, the electricity is produced. We model three variants: an hourly reference price; an annual reference price (the market value of onshore wind); and an annual reference that also suspends support when spot prices turn negative, the variant closest to the European Commission’s guidance (European Commission, 2025).
One-sided CfD
Under a one-sided CfD (the “market premium” model used in Germany since 2012, and also in the Netherlands and Italy), the government tops up revenues when prices fall below the strike, but the generator never pays money back. Price risk is therefore only partly mitigated: the contract behaves like no support when market prices are always high, and like a two-sided CfD when they are always low. We model the same three reference-price variants as for the two-sided CfD.
Financial CfD
The financial CfD, proposed by Schlecht et al. (2024), replaces production-based payments with a fixed-for-floating swap. The government pays the generator a fixed, capacity-based amount, and the generator pays back a variable amount tied to market prices and an external reference generation profile rather than to its own output. Because payments are “injection-independent”, the generator always has an incentive to stop producing when prices are negative, so market signals are preserved. The remaining risk stems only from deviations of a park’s actual output from the reference profile (“basis risk”). Two parameters define the contract: a reference profile (here, the national hourly capacity factor of onshore wind) and a contract factor that scales the contracted capacity. We model four specifications that differ in how the contract factor is set (baseline, fleet-optimal, technology-adjusted, and park-optimal), described in the table below and in Appendix A.1.
2.3 The ten specification
The analysis compares ten contract specifications in total, three per family for the two- and one-sided CfDs and four for the financial CfD, against the merchant baseline. Table 1 lists them and defines the labels used in the figures that follow.
| Label (in figures) | Family | Reference / factor | Description |
|---|---|---|---|
| Merchant | Baseline | No contract | No long-term contract; the generator sells all output on the spot market. Reference case. |
| 2-CfD Hourly | Two-sided | Hourly spot price | Guarantees a fixed per-unit price and removes price risk fully; produces “produce-and-forget” incentives. |
| 2-CfD Annual | Two-sided | Annual market value of onshore wind | Hedges price risk while keeping some spot-price incentive; introduces limited basis risk. |
| 2-CfD Annual (curtailed) | Two-sided | Annual market value of onshore wind | As above, but support is suspended when spot prices are negative (closest to the European Commission’s guidance). |
| 1-CfD Hourly | One-sided | Hourly spot price | Top-up only, with no clawback; partial price-risk mitigation. |
| 1-CfD Annual | One-sided | Annual market value of onshore wind | Top-up only, with an annual reference price. |
| 1-CfD Annual (curtailed) | One-sided | Annual market value of onshore wind | Top-up only, with support suspended when spot prices are negative. |
| F-CfD (baseline) | Financial | Contract factor = 1 | Capacity-based swap on the full installed capacity; injection-independent. |
| F-CfD (fleet-optimal) | Financial | Common factor, cost-minimizing | A single contract factor for all parks, chosen to minimize average investment cost (average downside risk). |
| F-CfD (tech-adjusted) | Financial | Factor ∝ expected output | Park-specific factor proportional to expected production, which limits adverse selection. |
| F-CfD (park-optimal) | Financial | Factor minimizing each LCOE | Park-specific factor chosen separately for each project to minimize its cost of electricity. |
3. Data and method in brief
3.1 Operational data from real wind parks
A key strength of this analysis is the use of real production data from operational turbines rather than simulated or synthetic profiles. Real-world output is shaped by constraints that are hard to model, such as turbine maintenance, curtailment for environmental permitting (bird or bat protection), noise and light limits, and local grid restrictions. These frictions may correlate systematically with price patterns, affecting the risk profile of investment projects. Observing the realized feed-in lets us capture these frictions directly and produce more realistic assessments of revenue volatility. The fact that the data includes a large number of projects also allows us to capture heterogeneity that simulations usually miss: not just different weather and price years, but differences in site quality and turbine technology.
The core dataset covers turbine-level production for 381 turbines across 93 German wind parks. After excluding parks that entered operation after 2014 and those with missing or persistently very low output, the estimation sample contains 268 turbines across 63 wind parks, with a combined capacity of about 510 MW and an average capacity factor of 18 percent, continuously observed over the ten years from 2014 to 2023. That window spans major market events, such as the Covid-19 period and the 2022–2023 energy crisis, as well as a wide range of weather years. Each observed year is weighted equally. The simulations combine this production data with hourly electricity prices (ENTSO-E), national feed-in profiles (Netztransparenz), and installed-capacity data (Open Power System Data and ENTSO-E).
Appendix A describes the dataset in more detail: the parks are concentrated in north-eastern Germany and are operated by a single company (Figure A1); this concentration limits how far the sample speaks to siting conditions elsewhere, although the spread of production profiles within it is wide (Figure A2).
3.2 From revenue risk to the cost of electricity
For each contract and each park, we simulate hourly revenues and aggregate them to annual figures. We then summarize cash-flow risk with the coefficient of variation of annual revenues, a standard normalized measure that allows comparison across parks of different sizes and production profiles.
Because investors and lenders ultimately care about financing costs, we then feed the simulated revenue distributions into a stylized project-finance model (see the full model in Appendix A.2). In line with project-finance practice, lenders size debt on low-percentile cash flows rather than average volatility: our model requires debt service to be covered in every simulated year (a debt-service coverage ratio of at least one in all states). Contracts that raise the minimum annual cash flow therefore permit more debt, which is cheaper than equity, and therefore lower the weighted average cost of capital (WACC) and, in turn, the levelized cost of electricity (LCOE). Assuming competitive auctions in which projects just break even, the model yields an implied LCOE for each contract and park. In other words, the LCOE and support levels are endogenous and both change by park and contract such that each project just breaks even. The key cost and financing assumptions are summarized in Table 2.
| Parameter | Value | Source | Note |
|---|---|---|---|
| Investment cost | 1,500 €/kW | IRENA (2024) | |
| O&M cost | 50 €/kW·a | IRENA (2024) | Includes land rents (a large share) |
| Cost of debt | 1.15 % | Đukan et al. (2025) | |
| Cost of equity | 10.0 % | Đukan et al. (2025) | |
| Project lifetime | 30 years | Own assumption |
4. Results
This section presents the empirical de-risking performance of the different contract designs. Using the simulated annual revenue streams, we first compare cash-flow risk across contracts using the coefficient of variation. We then examine the leverage and WACC outcomes of the financial model and the resulting reductions in LCOE. Next, we decompose the effect of each contract into a subsidy component and a de-risking component, show how the effect differs between parks, and estimate what each design costs the public when projects are procured in order of cost. The methods behind these results are detailed in Appendix A.
4.1 Cash-flow risk
Figure 1 summarizes cash-flow risk across wind parks under each contract specification, measured by the coefficient of variation of annual revenues. Three findings stand out. Wind parks under the merchant baseline exhibit very high CoVs, confirming that merchant exposure alone provides insufficient risk management for project finance. All CfD designs substantially reduce cash-flow risk relative to the merchant case, but to different degrees: two-sided and financial CfDs consistently deliver the lowest CoV values, while one-sided CfDs leave significantly more risk with investors. The difference lies in the upside: a two-sided CfD pays back revenue above the strike, whereas a one-sided CfD lets the generator keep it, as in the high-price years of the 2022–2023 energy crisis. Because strike prices are set so that each project just breaks even, they differ across contracts and parks, and a generator that keeps the upside needs a strike below its LCOE, which also lowers the floor that protects it in low-price years. Finally, two-sided CfDs achieve both very low CoVs and narrow distributions, whereas the lowest overall cash-flow risk is reached by park-optimal financial CfDs, even though these are optimized for downside risk rather than for the coefficient of variation.
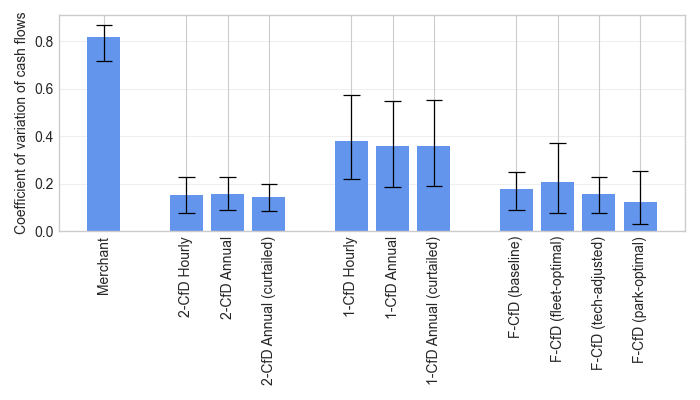
A second insight from Figure 1 is that using an annual reference price combined with curtailing generation during negative-price hours reduces cash-flow risk for both two-sided and one-sided CfDs, compared with hourly referencing, despite introducing some basis risk. The reason is that an annual reference moves with the price the park earns in the market. Annual revenue becomes the output multiplied by the strike plus the park’s own capture price minus the market value of onshore wind (see Equation 2 in Appendix A). The price level cancels, and what remains is the park’s basis against the fleet, which is less favorable in high-output years and so partly offsets volume risk. Using the market value of wind therefore appears preferable, since it leads to both better incentives and lower risk for investors.
4.2 Financing conditions and the cost of electricity
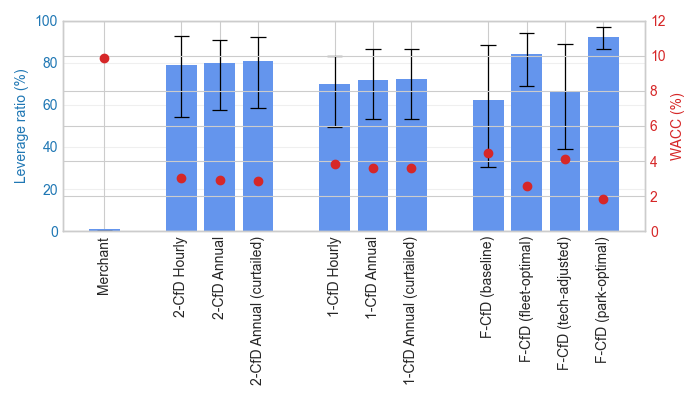
Feeding these cash-flow patterns into the financial model (see Appendix A.2), we calculate the equilibrium leverage ratios and WACC under each specification (Figure 2). Under the merchant baseline, most parks cannot afford any debt, because at least one year’s revenues would be insufficient to cover any debt service. This reflects the mechanics of the model, which links the minimum annual cash flow to risk-free leverage, together with the significant land rents that must be paid and the presence of several very low-price years in the sample, including the 2020 Covid-19 period. For all CfD contracts, leverage generally falls within the 40 to 90% range observed for real-world renewable projects under long-term contracts (Đukan et al., 2019; Roth et al., 2021). Two-sided CfDs tend to lower the cost of capital more than one-sided CfDs. Among financial CfDs, specifications with endogenous contract factors achieve the highest leverage, while those that set the contract factor exogenously perform somewhat worse than two-sided CfDs.
From the WACC we calculate the implied LCOE under each specification (Figure 3). All CfDs reduce LCOE relative to the merchant case by lowering financing costs (the de-risking effect), but the magnitude differs markedly across designs. Average LCOE reductions range between 40 and 60 €/MWh under our cost assumptions, which means that 30 to 45% of the LCOE can be removed through the better financing conditions the contracts make affordable. Two-sided CfDs deliver the largest reductions among the classical designs, reflecting their complete removal of price risk. One-sided CfDs also reduce LCOE, but less strongly, consistent with their weaker risk mitigation. Financial CfDs perform similarly to one-sided or two-sided CfDs depending on the contract factor, with optimal factors yielding the lowest LCOEs of all contracts.
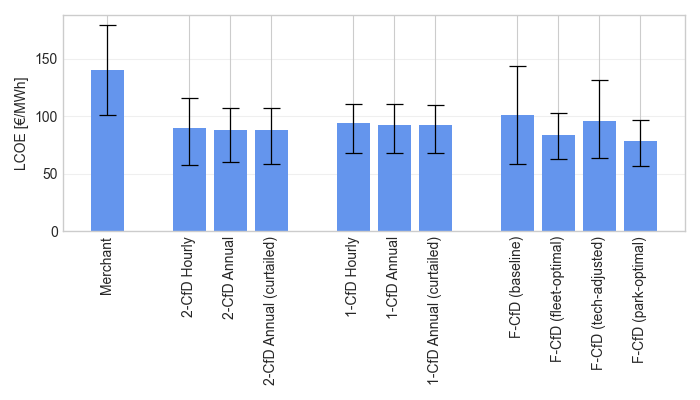
The figure shows that financial CfDs with well-chosen parameters can match or outperform two-sided CfDs in terms of both risk reduction and financing conditions. The reason is that the financial CfD also (partially) hedges volume risk. A production-based CfD pays per MWh produced, so a low-wind year still means low revenue; under the financial CfD, the generator’s payment back follows the national wind index, so in a low-wind year the park produces less but also pays back less. The common component of price and volume risk cancels, and what remains is the part of the park’s output that deviates from the reference profile. The contract factor works as a hedge ratio, which is why park-specific factors, matched to how closely each park tracks the index, outperform a single fleet-wide factor.
Taken together, these results show that having any form of long-term public support plays a major role in the ability to finance renewable investment, whereas the specific form of the contract plays a smaller role. That smaller effect is still significant: differences of around 22 €/MWh between designs are material at system scale. Since the electricity is worth the same in the market regardless of the contract, a difference in LCOE between two designs is a difference in the support the public pays for the same project. The difference of 22 €/MWh between the cheapest and the most expensive design in Figure 3 is therefore the gap in public cost, and it arises entirely from differences in financing costs under each contract. Weighted by output the same gap is 16 €/MWh, which for the 510 MW in this sample is a difference of between 15 and 28 million euros a year.
The size of the de-risking effect is not the same for every park. A useful way to separate projects is by whether a project’s own capture price is higher than the market value of onshore wind over the sample period (56.9 €/MWh), that is, whether its output is higher-quality than average. Four of our 63 parks earn more under market prices than they would facing a flat price at the level of the market average, and 59 earn less. The distribution is shown in Figure A3: most parks sit a little below the national mean, as one might expect of an aging fleet, and two sit well above it.
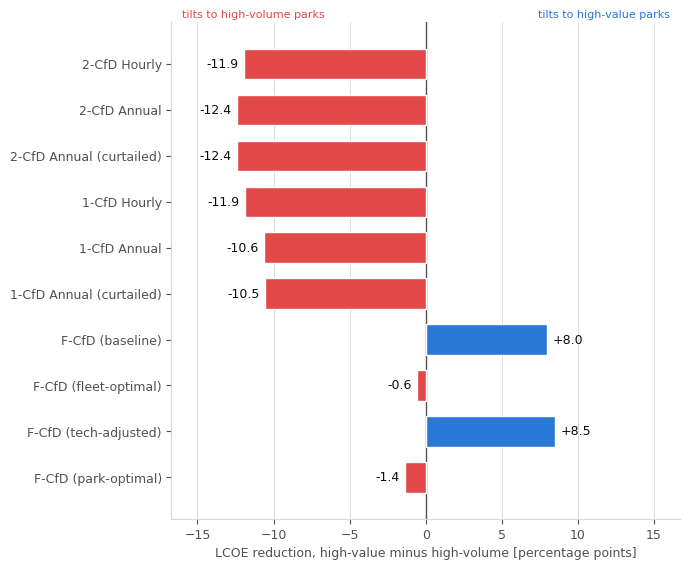
Figure 4 reports the difference in the proportional reduction in the cost of electricity between the two groups by contract. Every contract design that pays per unit of output has a de-risking effect tilted towards the high-volume parks. Where remuneration is, or approaches, a fixed amount per MWh, the annual cash flow that sizes the debt is linear in the park’s annual production, so the contract de-risks in proportion to how stable that production is, and the value of the output does not enter. The financial CfD is the only family whose payment is decoupled from the park’s own output. Those specifications with exogenous contract factors (baseline and technology-adjusted) are the only designs that proportionally favor the high-value parks. That is the consequence of an oversized hedge: the claw-back is calculated on full installed capacity against a national reference profile, and the parks whose market income per MW falls furthest short of that reference are over-hedged the most. Endogenizing the factor removes the mis-sizing and the difference between the groups falls below 1.5 percentage points. The high-value group contains four parks, so the size of these differences should be read with care. Fitting the same relationship across all 63 parks instead of splitting them gives smaller differences (under five percentage points in either direction) but the same sign for every design.
4.3 Subsidy versus de-risking
As noted in the introduction, long-term public contracts simultaneously subsidize revenues and hedge investors against cash-flow risk. We disentangle the two by decomposing how each contract closes the “merchant gap”, defined as the difference between the LCOE and the capture price a project would earn under merchant exposure. Consider a project with a capture price of 30 €/MWh and an LCOE of 90 €/MWh: the merchant gap is 60 €/MWh. If a contract reduces costs to 50 €/MWh by enabling low-cost financing, then 40 €/MWh of the gap is closed through risk reduction and the remaining 20 €/MWh must come from an outright subsidy. In this example, two-thirds of the support effect arises from de-risking. This is a good deal for public finance, because only the subsidy strains public budgets.
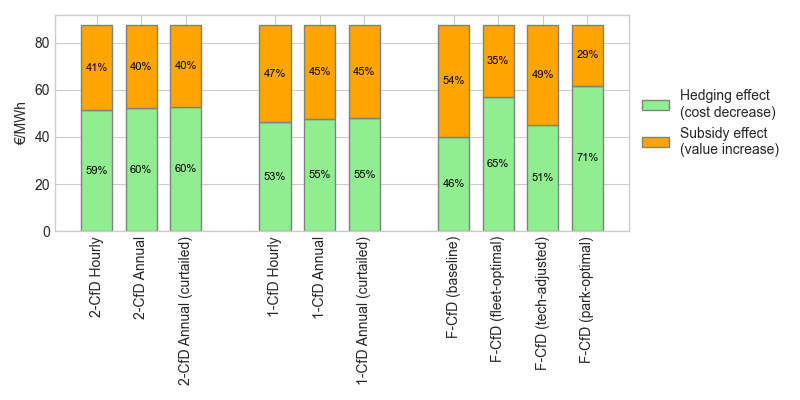
The results are shown in Figure 5. The merchant gap to be closed for a project to be viable is the same regardless of contract, on average 87 €/MWh, but contracts differ in the relative size of their hedge and subsidy components. For two-sided CfDs, de-risking amounts to around 52 €/MWh, and the remaining 35 €/MWh comes from higher effective prices via the subsidy. For the fleet-optimal financial CfD, the hedging effect makes up 57 €/MWh, and for the park-optimal financial CfD it reaches around 62 €/MWh, with only 25 €/MWh of subsidy. For the park-optimal financial CfD, every 1 € of subsidy is accompanied by 2.4 € of lower financing costs, for a total of 3.4 € in social value of public funds thus spent; for the two-sided CfD these figures are 1.5 and 2.5 € respectively.
Rather than the exact figure of the return on spent public funds, the relevant takeaway is that contract design can leverage public funds substantially by targeting cash-flow risk rather than price levels alone. Considering this decomposition beyond our sample, we can see that the two components rest on different features. The de-risking effect works through debt capacity, which the model derives from the worst year observed. The subsidy component works through the merchant gap, which depends on the average capture price. The sample spans an exceptional price episode from 2021 to 2023, which raises the average capture price and reduces the need for a subsidy. This does not apply to the worst year for two-sided and merchant contracts, such that their de-risking estimates are likely robust; for the financial CfD, however, the crisis years are often the worst years, so the de-risking estimate for that contract is, if anything, conservative.
4.4 Project procurement
Section 4.3 reported what each design costs the public when every park in the sample is financed. That is not necessarily how procurement works. An auction awards contracts to the cheapest projects and leaves the rest unbuilt, so what the public pays depends on how far down the merit order procurement reaches.
Figure 6 ranks the parks by their cost under each contract, procures the cheapest first, and reports the average net public support for the volume procured. Here, each winner receives its own break-even remuneration. Bidding at true cost is the dominant strategy under uniform pricing, as in the day-ahead market, but not under the pay-as-bid rule German auctions use, where a winner has an incentive to bid above its cost. The figure is therefore systematically lower than public costs under either rule. Table C1 in Appendix C holds our estimate of inframarginal winner rents, assuming the cheapest 20 projects under each design are procured. The curves rise throughout, because procuring more means reaching further down the merit order.
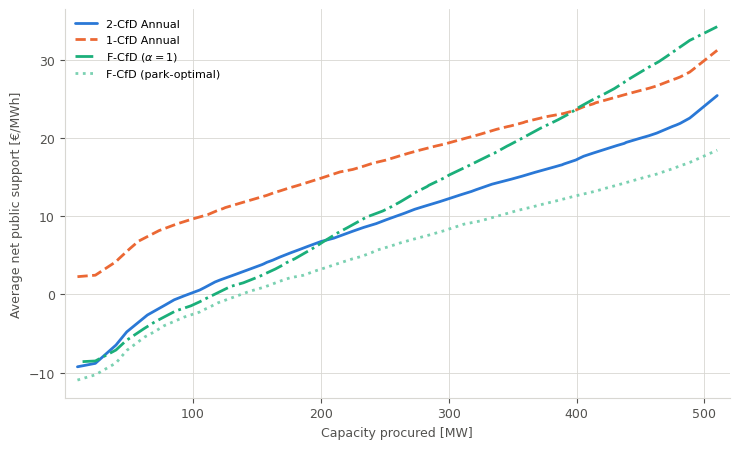
At small volumes (less than 100 to 150 MW in our sample) net public support is negative under most designs. With only these projects, over 2014–2023, the state would have received more in claw-backs than it paid out. Rather than being subsidized, these projects benefit from the debt capacity a long-term contract provides, and over this price history the contract pays for itself. The one-sided CfD is the exception, constituting a net cost at every volume, because it never claws back.
The ranking of designs is stable across volumes, with one exception. The financial CfD with a contract factor of one crosses the others: at 10 MW it is close to the two-sided CfD, and at full procurement it is the most expensive design. A hedge of that size is adequate for a small and homogeneous set of good projects and expensive once procurement reaches a heterogeneous fleet.
The one-sided designs move the other way. They are relatively priciest at the lowest volumes (where it could matter more for new procurement), and become relatively cheaper as procurement reaches more expensive projects: the strike rises, the top-up binds in more years, and the contract behaves more like a two-sided CfD.
5. Discussion and policy implications
Using real hourly production data from 63 wind parks over ten years, this report compares how three families of long-term public contracts mitigate investment risk for onshore wind, and how that risk reduction feeds through to the cost of electricity. We simulate project revenues under two-sided CfDs, one-sided CfDs, and financial CfDs, and quantify cash-flow risk using both the coefficient of variation of annual revenues and a project-finance model focused on downside risk. In that model, debt capacity is determined by low-revenue states, with debt service required to be covered in all simulated years and equity bearing the residual risk. Under competitive auctions, contract levels are set so that both the debt and equity constraints bind, which yields an implied LCOE for each design.
Financial CfDs can perform as well as, if not better than, one-sided and two-sided CfDs in reducing cash-flow risk and lowering LCOE, while preserving more exposure to market signals. When contract parameters are calibrated appropriately, these improvements do not require higher public spending. A contract factor of one over-hedges most parks and makes the financial CfD the most expensive design, whereas choosing it per park makes it the cheapest. Park-specific factors may not be available in a central auction, since the quality of an asset is often unknown to the auctioneer. One way to reconcile the two is to let bidders choose their own contracted capacity and rank them by expected net support per MWh, in the spirit of the German reference-yield model, which already scales the award by site quality. Well-calibrated financial CfDs relax the classic trade-off between risk mitigation and market integration: they substantially reduce investor risk without fully insulating producers from market dynamics. The same can be argued for two-sided CfDs with annual reference profiles and curtailment during negative-price hours.
The decomposition of the merchant gap shows that a large share of the value these contracts create can come from de-risking rather than from pure price support. For the most effective designs in our sample, roughly 60 to 70% of the gap is closed through lower financing costs, with the remainder due to higher effective prices. Given the capital intensity of renewable investment, carefully designed contracts can therefore deliver substantially cheaper clean electricity for a given level of public expenditure, without necessarily implying excessive returns for generators. This holds especially where support is allocated through competitive auctions, in which lower risk is often associated with lower equity returns (Đukan et al., 2019). Where auctions are undersubscribed and awards settle near the ceiling price rather than at break-even, the savings in public cost shown in Sections 4.3 and 4.4 do not materialize.
These findings indicate that contract design, rather than more public spending in the form of higher subsidy levels, can simultaneously improve investment conditions and support the market integration of renewables. As renewable penetration continues to increase, aligning risk mitigation with efficient dispatch will be critical to sustaining the energy transition. Any change of support scheme creates winners and losers. Under a financial CfD this is the intended effect rather than a side effect: the generator keeps its full market income, so projects gain when they produce at times when electricity is valuable and lose when they produce mainly when it is abundant. This redistribution is the price signal that steers siting and turbine choice towards more valuable output, which a contract paying per MWh produced weakens.
For a scheme designed now, we make two practical recommendations. First, for production-based contracts, reference the contract to the annual market value of onshore wind rather than to the spot price of the settlement period and suspend support in negative-price hours: on this sample that combination lowers both investor risk and public cost. And second, if a financial CfD is used, the contract factor can be set in different ways: leaving it at one gives tight incentives that promote high-value investment and stays cheap for a small set of assets, while setting it per project is the cheapest option at any volume procured, at the same return to the investor, though harder to implement.
Limitations
Several limitations should be borne in mind. These pertain to the model, the sample and our assumptions. First, because the analysis relies on historical data rather than a full market model, it does not capture the feedback from contract-specific dispatch incentives to market prices. During most of the sample period, German onshore wind was remunerated through feed-in tariffs or premiums, which encouraged production even at strongly negative prices. Under schemes with stronger price exposure (annual reference prices or financial CfDs), some of this output would likely have been withheld, raising prices in those hours and potentially changing contract performance. Similarly, under different support schemes, the set of projects procured would be different (Figure 6), such that the price path would be different. Finally, the same caveat applies to the suspension of support at negative prices. This is relevant because in our sample, negative prices occurred mostly in high-wind periods, with a countercyclical effect; but as solar capacity grows and more negative prices are driven by solar rather than wind generation, the risk impact of suspended payments could change. The results should therefore be read as partial-equilibrium revenue outcomes for given price and investment paths.
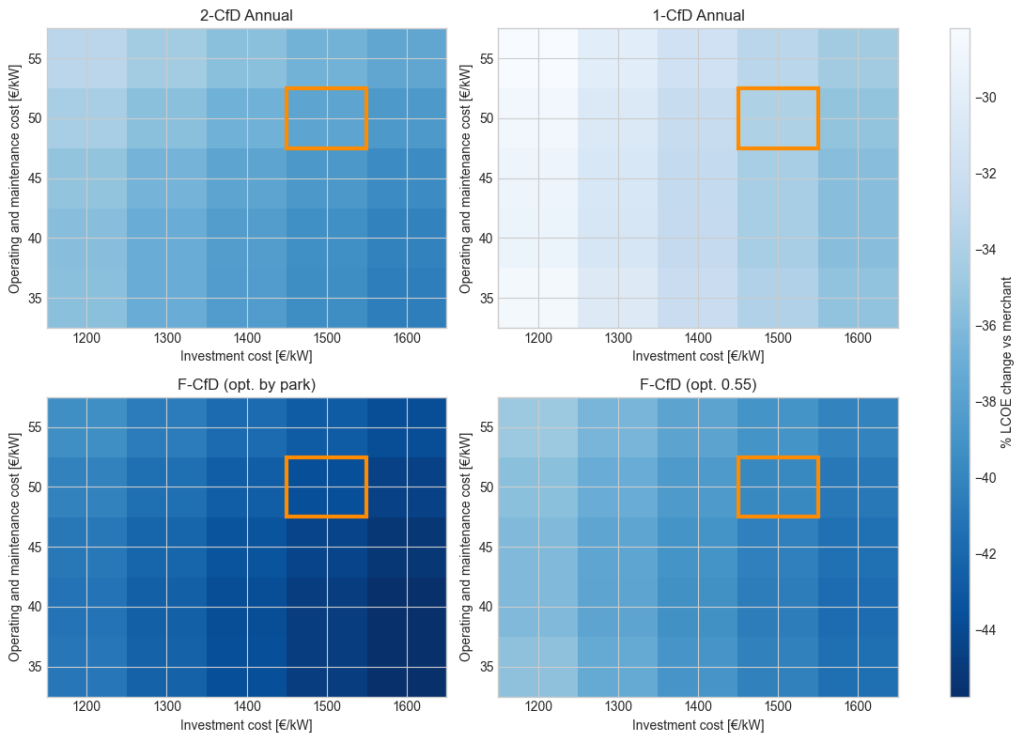
A second limitation is that cost and financing assumptions are homogeneous across parks of different vintages and sites, which affects absolute LCOE levels; a sensitivity analysis (Appendix B) shows that the ranking of contracts is nonetheless robust across a wide range of cost assumptions. The financial CfD is implemented with a single national reference profile; location-specific benchmarks would change basis risk but not the core requirement that benchmarks stay exogenous enough to preserve dispatch incentives. Finally, each park is treated as a standalone investment, whereas investors often hold diversified portfolios that could dampen project-specific volatility.
Third, regarding our assumptions, the debt-service constraint we impose is unusual in its shape: full coverage in every observed year, at a coverage ratio of one. Project finance normally requires a ratio of 1.2 to 1.3, but against a modeled downside case rather than against every historical year. Our rule is therefore more lenient in level and stricter in the states it must hold in. Overall, our model seems more likely to overstate debt capacity and understate the cost of electricity, but this counters the fact that we apply today’s (higher) investment and land costs to a fleet built up to two decades ago. Our model does also not account for contract complexity: a production-based CfD settles on metered output and is easily explained; the financial CfD settles a swap against an external profile, and a lender unfamiliar with it might price the resulting risk more conservatively than our ex-post analysis shows.
One feature of our sample points in a useful direction. The fleet we observe was built under volume-based remuneration, and it comes as no surprise that only four of 63 parks earn more under market prices than at a flat price equal to the market value of onshore wind (Figure A3). Any study using real operational data will meet a similar problem, because the fleet that exists was built under the contracts that existed. Our sample sits below the average, but we can still learn from it what a more diverse or higher-value fleet would do to the comparison. Two-sided CfDs de-risk volume-driven parks more; financial CfDs with endogenous factors are close to neutral between the two; the unsized financial CfD favors high-value parks. The gap between the families would therefore widen rather than narrow in the kind of fleet that new procurement is meant to bring forward. Read the other way, our sample may be an unfavorable case for the financial CfD, and its sample-calibrated variants still perform at least as well as the alternatives.
Appendix A. Methods and data
Appendix B. Robustness
Appendix C. Additional results
Literaturangaben
Alcorta, P., Espinosa, M. P., & Pizarro-Irizar, C. (2024). Right and Duty: Investment Risk Under Different Renewable Energy Support Policies. Environmental and Resource Economics, 87(12), 3163–3204.
Augustin, P., Cong, L. F., Lopez A., R., & Tédongap, R. (2025). Downside Risk and the Cross-section of Corporate Bond Returns (SSRN Scholarly Paper No. 3710533). Social Science Research Network.
Barquín Gil, S., Rodilla Rodríguez, P., Cossent Arín, R., & Battle López, C. (2017). Obtaining best value for money in RES auctions: A capacity-based with an embedded menu of contracts approach. Working Paper IIT.
Chebotareva, G., Strielkowski, W., & Streimikiene, D. (2020). Risk assessment in renewable energy projects: A case of Russia. Journal of Cleaner Production, 269, 122110.
Đukan, M., Keles, D., & Kitzing, L. (2025). The Impact of Two-Sided Contracts for Difference on Debt Sizing for Offshore Wind Farms. The Energy Journal, 46(5), 145–188.
Đukan, M., Kitzing, L., Brückmann, R., Jimeno, M., Wigand, F., Kielichowska, I., Klessmann, C., & Breitschopf, B. (2019). Effects of auctions on financing conditions for renewable energy.
ENTSO-E. (2024). Position Paper on Sustainable Contracts for Difference Design.
European Commission. (2024, April 30). State aid to support construction of nuclear power plant.
European Commission. (2025, December 19). Commission guidance on the design of two-way contracts for difference. Official Journal of the European Union, (C/2025/6701).
Fabra, N., & Llobet, G. (2025). Designing Contracts for the Energy Transition.
Falconett, I., & Nagasaka, K. (2010). Comparative analysis of support mechanisms for renewable energy technologies using probability distributions. Renewable Energy, 35(6), 1135–1144.
Favre, K., & Roques, F. (2023). Designing Contracts for Difference for the EU Power Markets: Trade-off between Incentives and Risks. 2023 19th International Conference on the European Energy Market (EEM), 1–6.
Gatzert, N., & Kosub, T. (2016). Risks and risk management of renewable energy projects: The case of onshore and offshore wind parks. Renewable and Sustainable Energy Reviews, 60, 982–998.
Huntington, S. C., Rodilla Rodríguez, P., Herrero, I., & Battle López, C. (2017). Revisiting support policies for RES-E adulthood: Towards market compatible schemes. Energy Policy, 104, 474–483.
IRENA. (2024). Renewable Power Generation Costs. International Renewable Energy Agency.
Johanndeiter, S., Helistö, N., & Bertsch, V. (2025). Does the difference make a difference? Evaluating Contracts for Difference design in a fully decarbonised European electricity market. Resource and Energy Economics, 101495.
Leblanc, C. (2023). Microeconomic analysis of subsidy mechanisms for power generation from wind and solar sources [PhD Thesis, École des Ponts ParisTech].
Li, X., Gupta, J., Bu, Z., & Kannothra, C. G. (2023). Effect of cash flow risk on corporate failures, and the moderating role of earnings management and abnormal compensation. International Review of Financial Analysis, 89, 102762.
Minton, B. A., & Schrand, C. (1999). The impact of cash flow volatility on discretionary investment and the costs of debt and equity financing. Journal of Financial Economics, 54(3), 423–460.
Minton, B. A., Schrand, C. M., & Walther, B. R. (2002). The role of volatility in forecasting. Review of Accounting Studies, 7(2–3), 195–215.
Molina Manzano, C. (2005). Are Firms Underleveraged? An Examination of the Effect of Leverage on Default Probabilities. Journal of Finance, 60(3), 1427–1459.
Newbery, D. (2023). Efficient Renewable Electricity Support: Designing an Incentive-compatible Support Scheme. The Energy Journal, 44(3).
Roth, A., Brückmann, R., Jimeno, M., Đukan, M., Kitzing, L., Breitschopf, B., Alexander-Haw, A., & Blanco, A. L. A. (2021). Renewable energy financing conditions in Europe: Survey and impact analysis. Aures.
Schlecht, I., Maurer, C., & Hirth, L. (2024). Financial contracts for differences: The problems with conventional CfDs in electricity markets and how forward contracts can help solve them. Energy Policy, 186, 113981.
Staffell, I., & Pfenninger, S. (2018). The increasing impact of weather on electricity supply and demand. Energy, 145, 65–78.
Tang, D. Y., & Yan, H. (2010). Market conditions, default risk and credit spreads. Journal of Banking & Finance, 34(4), 743–753.