Table of Contents
Key Messages
- Actual real-world fuel consumption of Plug-In Hybrid Electric Vehicle (PHEV) in Europe slightly increased to around 6.0 to 6.2 l/100 km between the registration years 2021 and 2023 for both gasoline and diesel PHEVs. At the same time, type-approval fuel consumption has decreased from 1.7 to 1.25 l/100 km for gasoline PHEV and from 1.4 to 1.0 l/100 km for diesel PHEV. All manufacturers clearly exceed the type-approval values by 300 – 500 percent.
- The current 2025 utility factor (UF) curve, which means the share of km driven mainly electrically for a given all-electric range, is still too optimistic for real-world usage of PHEV and should be further reduced. The adjustment planned by the European Union for 2027 gives the right order of magnitude but further slight adjustments might be needed.
- A potential regulatory framework allowing limited PHEV registrations beyond 2035 in the EU would undermine the current efforts in GHG emissions mitigation and make the climate neutrality target of the EU until 2050 much less likely as the vehicles remain in the fleet for many years.
- Manufacturers could allocate a small share, for example 5 to 10 percent of their annual new vehicle fleet, to plug-in hybrid electric vehicles if these meet strict performance criteria like existing regulation north America.
- Technical requirements could include a minimum electric driving range of at least 100 kilometers and vehicle logic that prioritizes electric driving wherever possible.
- We further suggest that vehicles should not emit more than, e.g., 10 grams of CO2 per kilometer in real-world driving.
- If these criteria are not met, manufacturers should face financial penalties. This approach would enable a limited role for PHEVs in the transition to zero-emission transport while ensuring that only the most efficient and properly used models remain eligible.
- For verification and analysis, the OBFCM data already collected which would allow a regulation based on real-world data instead of test cycles.
The European Union’s commitment to climate neutrality by 2050 requires a rapid transformation of the transport sector, particularly road transport. Plug-in Hybrid Electric Vehicles (PHEVs), combining electric and combustion propulsion, have been promoted as a transitional technology and have benefited from favorable regulatory treatment and national incentives. However, extensive empirical evidence shows that real-world CO2 emissions from PHEVs are often significantly higher than certified values due to infrequent charging and dominant use of the combustion engine. In response, the European Commission plans to revise PHEV emissions calculations for the EU car fleet targets based on On-Board Fuel Consumption Monitoring (OBFCM) data. At the same time, extended-range PHEVs in China and calls from industry to exempt PHEV from the EU’s 2035 combustion engine sales ban have reignited interest in the future role of PHEVs in Europe.
For this reason, the present study:
- analyses real-world fuel consumption of PHEVs based on the now available single vehicle OBFCM data from about 850 thousand PHEV in Europe for descriptive statistics of PHEV fuel consumption;
- provides an update of the electric driving share curve assumed in European CO2 emissions regulation of PHEVs (Regulation (EU) 2019/631) based on the new data;
- discusses if and under which conditions new PHEV could potentially still be sold after 2035 in Europe with a long-term utilization of OBFCM data.
1. Background and Motivation
The European Union (EU) has committed to achieving climate neutrality by 2050, with the transport sector playing a pivotal role in this transition (about 25 percent of CO2 emissions in 2024). Road transport accounts for approximately 70 percent of transport-related CO2 emissions in the EU, with passenger cars representing a substantial portion of this figure. In response, the EU has implemented progressively stringent CO2 emission standards for new passenger vehicles (Regulation (EU) 2019/631).
Plug-in Hybrid Electric Vehicles (PHEVs) combine an internal combustion engine with an electric drivetrain and have been promoted as a transitional technology to bridge the gap between conventional vehicles and battery electric vehicles (BEVs) (Bradley et al. 2009). PHEVs offer the potential for reduced tailpipe emissions and increased fuel efficiency, particularly when operated predominantly in electric mode. Consequently, they have been integrated into the EU’s regulatory framework, benefiting from favorable treatment under CO2 emission standards and various national incentive schemes.
However, empirical studies have highlighted a significant discrepancy between the certified and real-world emissions of PHEVs (Plötz et al. 2020, 2021, 2022, Raghavan & Tal 2022, Isenstadt et al. 2022). High-level summary statistics of data collected through On-Board Fuel Consumption Monitoring (OBFCM) systems demonstrate that most PHEVs emit substantially more CO2 than their official ratings suggest (EEA 2025), primarily due to infrequent charging and predominant use of the combustion engine. This divergence has prompted the European Commission to revise the methodology for calculating PHEV emissions, aiming to align official figures more closely with actual usage patterns. This methodology is planned to be updated with the newly available OBFCM data (EC 2023).
At the same time, PHEV with much longer ranges, so-called Extended Range Electric Ve-hicles (EREVs), have gained new interest by vehicle buyers in China (IEA 2025) and have been called to be exempted from the 2035 EU fleet-wide CO2 emission target of 0 gCO2/km by the German automotive association (VDA 2025) and in consequence allow fossil-fuelled partially combustion engine vehicles to be newly registered even after 2035. Thus, there is new interest in real-world emissions and potential changes in the emission regulation of PHEV in Europe.
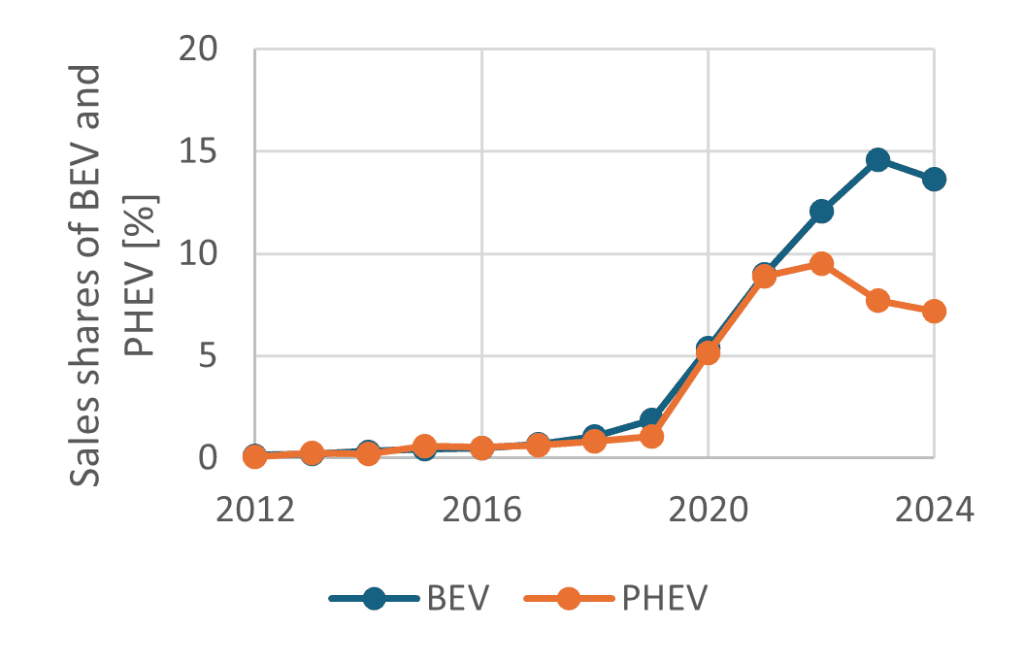
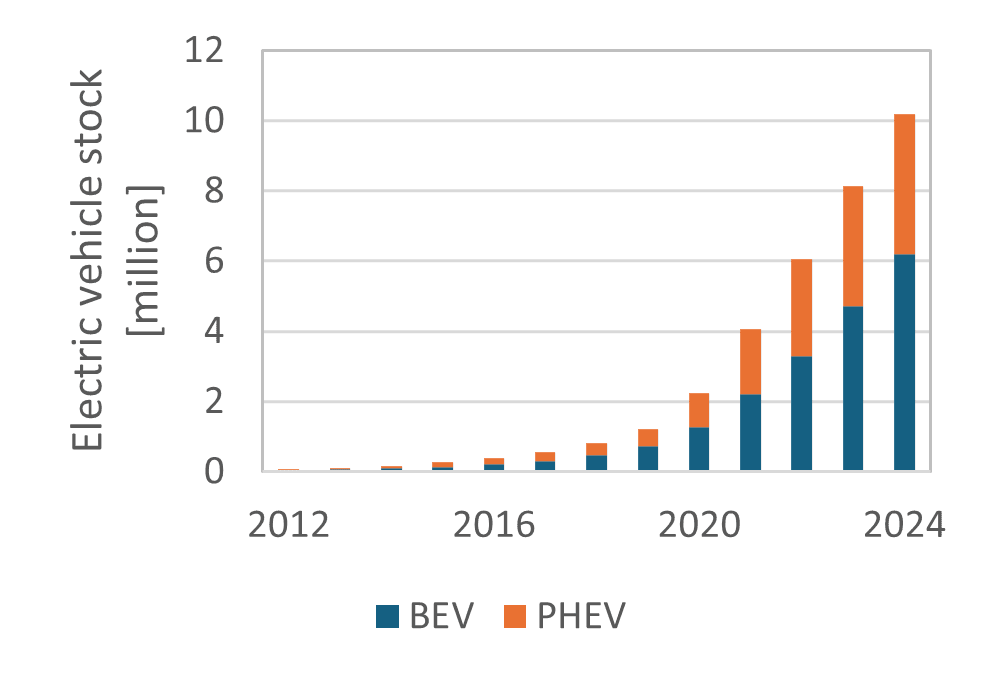
The share of new electric passenger car registrations in EU27 largely rose in the last 5 to 6 years with a small decrease in 2024, mainly due to a stagnation of new BEV registrations in Germany (IEA 2025). Until 2021, the registration shares of BEV and PHEV were almost the same, while BEV shares have increased and PHEV shares remained stable thereafter (see left panel of Figure 1). Thus, the current 10.5 million electric vehicles in stock consists of 4 million PHEV and 6.5 million BEV (see right panel of Figure 1).
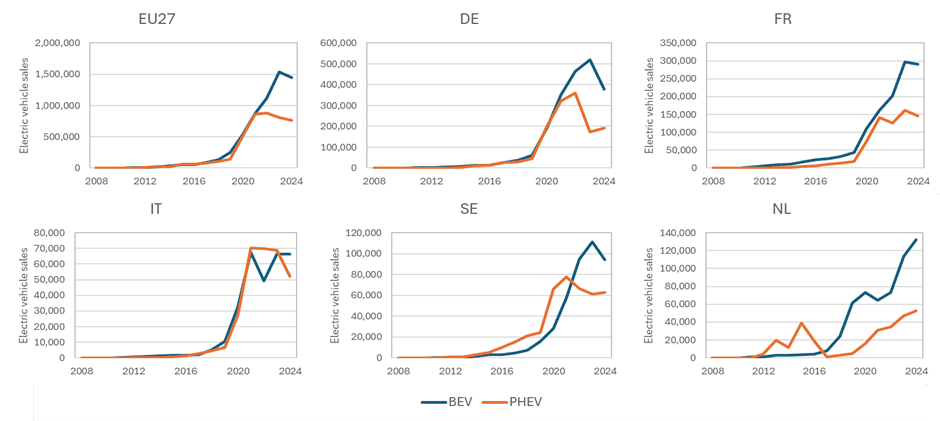
Furthermore, we find these slightly decreasing shares of new PHEV registrations in four of the five main European markets for EVs in which 66 percent of all EVs in EU27 were sold (Germany, France, Italy and Sweden; see Figure 2). In The Netherlands, market shares for PHEVs were down to zero in 2017 after a company car subsidy was phased out. For this reason, we find increasing market shares for PHEV also after 2021 in The Netherlands.
The aim of the present study is to address these questions and (1) provide an overview of real-world PHEV CO2 emissions from newly available OBFCM data, (2) recalculate realistic electric driving shares in regulatory emission calculations of PHEV and (3) discuss if and under which conditions PHEV could potentially be newly registered after 2035 in Europe.
The outline is as follows. The next section 2 introduces the OBFCM data and describes real-world consumption from PHEV in Europe based on this data. Section 3 contains the current regulation of PHEV treatment in Europe followed by a re-calculation with the OBFCM data. The final section 4 discusses if and under which conditions PHEV could be newly registered in Europe after 2035.
2. Real-world vs. type approval fuel consumption of PHEVs
2.1 Definitions and OBFCM data
In the European Union, plug-in hybrid electric vehicles (PHEVs) are type-approved under the Worldwide Harmonized Light Vehicles Test Procedure (WLTP), which replaced the NEDC (New European Drive Cycle) starting in 2017. The WLTP aims to reflect more realistic driving conditions and includes detailed procedures for assessing CO2 emissions and fuel consumption of PHEVs, which combine electric and internal combustion propulsion.
Under WLTP, PHEV operation is separated into two primary driving modes:
- Charge-depleting mode (CD): The vehicle draws primarily on the battery for propulsion until it is depleted to a predefined minimum state of charge. This mode reflects the electric driving capability of the vehicle. The engine would be mostly off in CD mode.
- Charge-sustaining mode (CS): Once the battery is depleted, the vehicle operates in hybrid mode, with the internal combustion engine (ICE) approximately main-taining the battery’s state of charge and providing propulsion as needed (effec-tively operating the vehicle like a hybrid without plugging). The engine would be mainly running in CS mode.
For an analysis of real-world and WLTP fuel consumption, we use on-board fuel consump-tion metering (OBFCM) data from (EEA 2025). Since 2021, vehicle manufacturers are obliged to report their real-world fuel consumption data during the first vehicle inspec-tion. We use this OBFCM data of newly registered PHEV in Europe between 2021 and 2023. The European Energy Agency (EEA) offers both aggregate and raw data files. We downloaded and analyzed all of them. The raw data files are 2.5 GB in total and contain gasoline and diesel vehicles (including mild and full hybrid) as well PHEVs.
We only used PHEVs and exclude vehicles from the analysis with too low mileage and unplausible values (following the data selection by the EEA – variable „Used in calculation“ equals one). We cleaned the data and harmonized PHEV descriptors as well as brand names. The total final data set used contains fuel consumption information from 1.4 million PHEVs and Table 1 shows the distribution of the data according to registration year (not data year) and fuel type.
| Year | Gasoline PHEV | Diesel PHEV |
|---|---|---|
| 2021 | 711,60 | 117,015 |
| 2022 | 400,296 | 49,049 |
| 2023 | 125,026 | 8,981 |
| Total | 1,237,082 | 175,047 |
The data contains many variables described in the Annex. We use “Total fuel consumed (lifetime) (l)” and “Total distance travelled (lifetime) (km)” to calculate the lifetime fuel consumption in litres/100 km. Furthermore, the share of CD-mode-km is calculated from the sum of “Total distance travelled in charge depleting operation with engine off (lifetime) (km)” and “Total distance travelled in charge depleting operation with engine running (lifetime) (km)” divided by “Total distance travelled (lifetime) (km)”. Likewise, the share of km in CD-mode with engine off is calculated from the total distance driven in CD-mode with engine off and the total distance driven. These are calculated individually per vehicles and then averaged over several vehicles, for example by make or model.
2.2 Real-world PHEV Fuel consumption
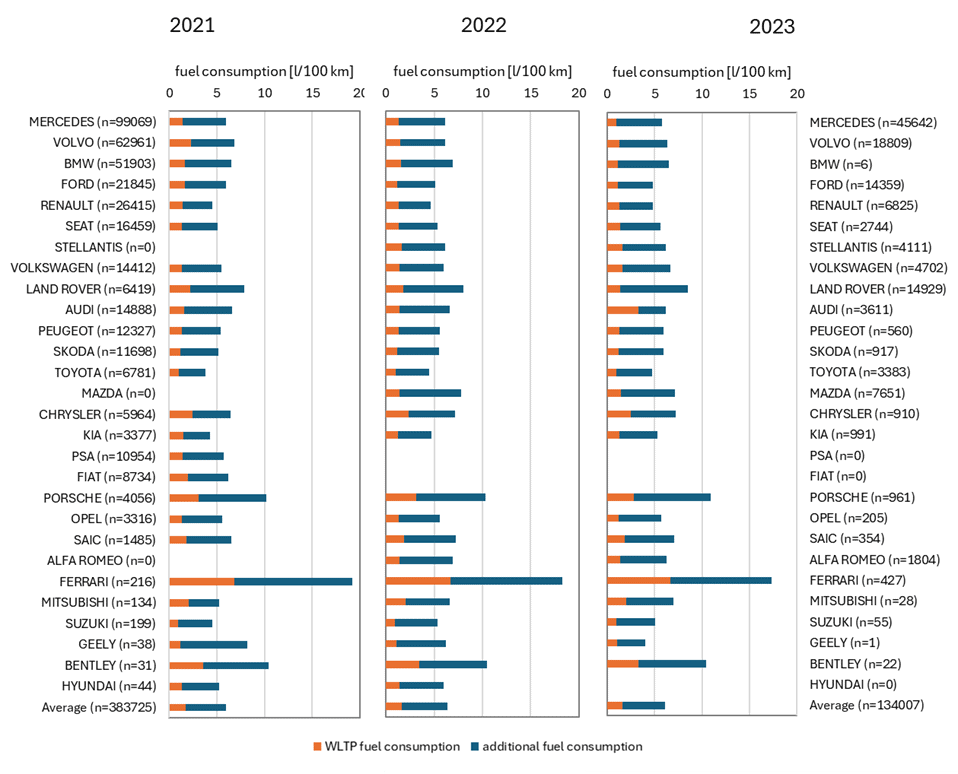
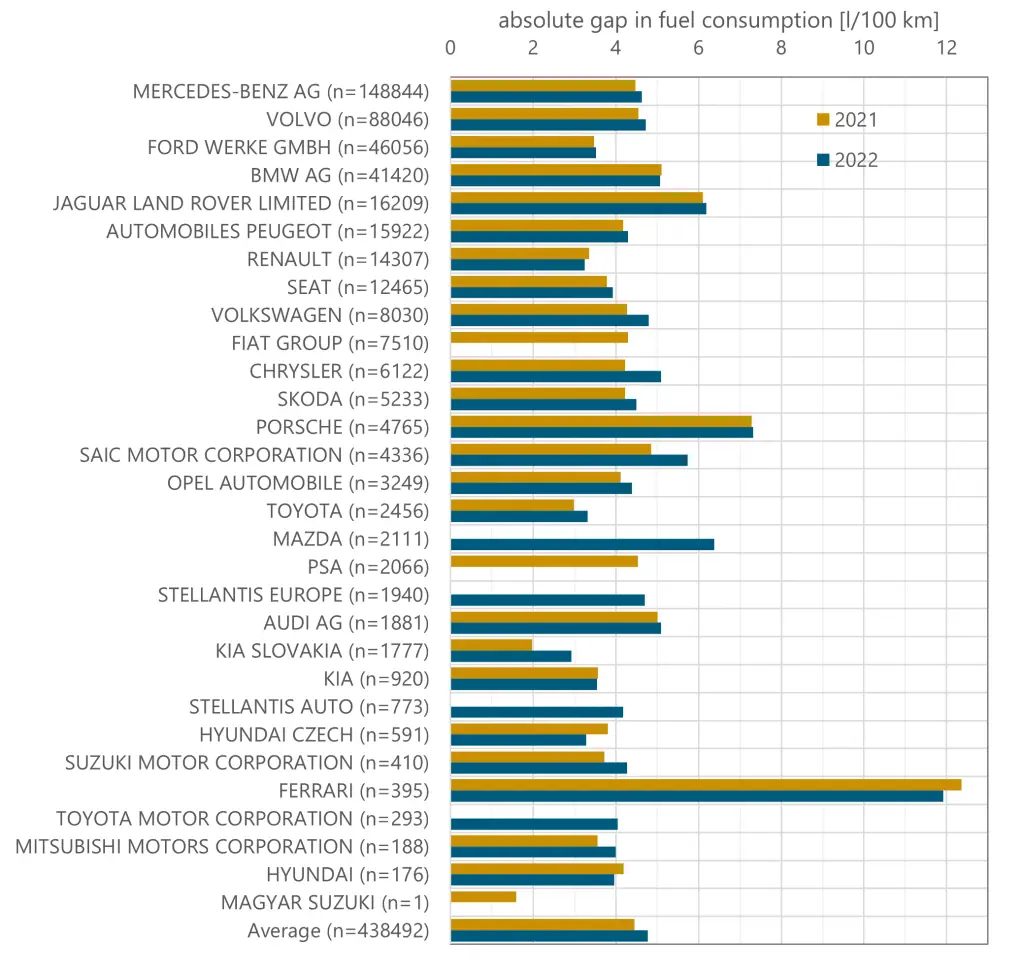
Figure 34 shows the average real-world fuel consumption of PHEVs by manufacturer in Europe for the years 2021 (blue bars), 2022 (orange) and 2023 (blue bars), based on 849,895 vehicle records from the years 2021 to 2023.
The data reveal substantial inter-brand differences in average fuel consumption. Manufacturers such as Mercedes-Benz, Volvo, and BMW consistently exhibit higher fuel consumption, often above 8 – 10 l/100 km, indicating limited electric driving and possibly frequent use of charge-sustaining or charge-increasing modes. In contrast, brands like Toyota, Hyundai, and Kia report lower average fuel consumption values (typically below 5 l/100 km), suggesting more frequent electric operation.
From 2021 to 2023, the average real-world fuel consumption increased slightly across most brands, with some exceptions. The average across all brands rose marginally. Notably, Porsche and Ferrari show exceptionally high average consumption values, consistent with their performance-oriented PHEV models and possible under-use of electric driving capabilities.
This data highlights the high real-world fuel consumptions and thus CO2 emission values, particularly for certain brands.
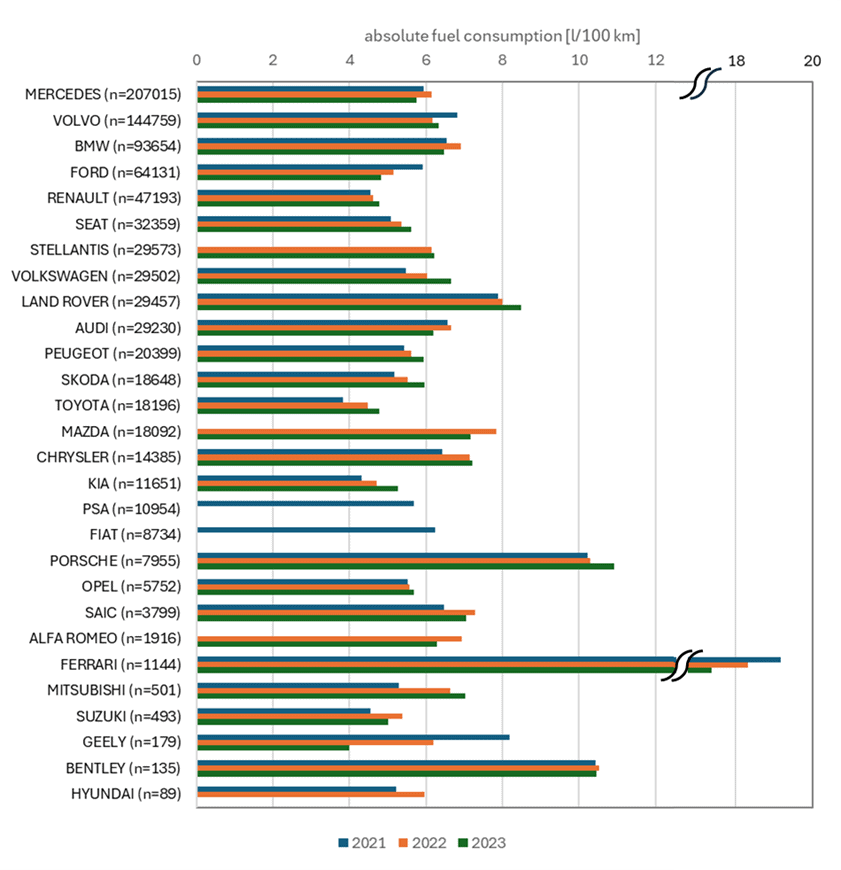
Missing values if no PHEV of respective brand were sold in that year. Own illustration with data from (EEA 2025).
Figure 4 presents the distributions of real-world fuel consumption for PHEVs from different manufacturers. The data is visualized using ridge density plots, which show the spread and shape of consumption values per brand. Black dots indicate the median fuel consumption for each brand, while the vertical dashed line marks the overall fleet average of almost 6 l/100 km as a reference point. Figure 4 illustrates the substantial gap between overall average values and the spread within one brand and between the brands. Especially brands targeting larger or more powerful PHEV models show very high real-world fuel consumption.
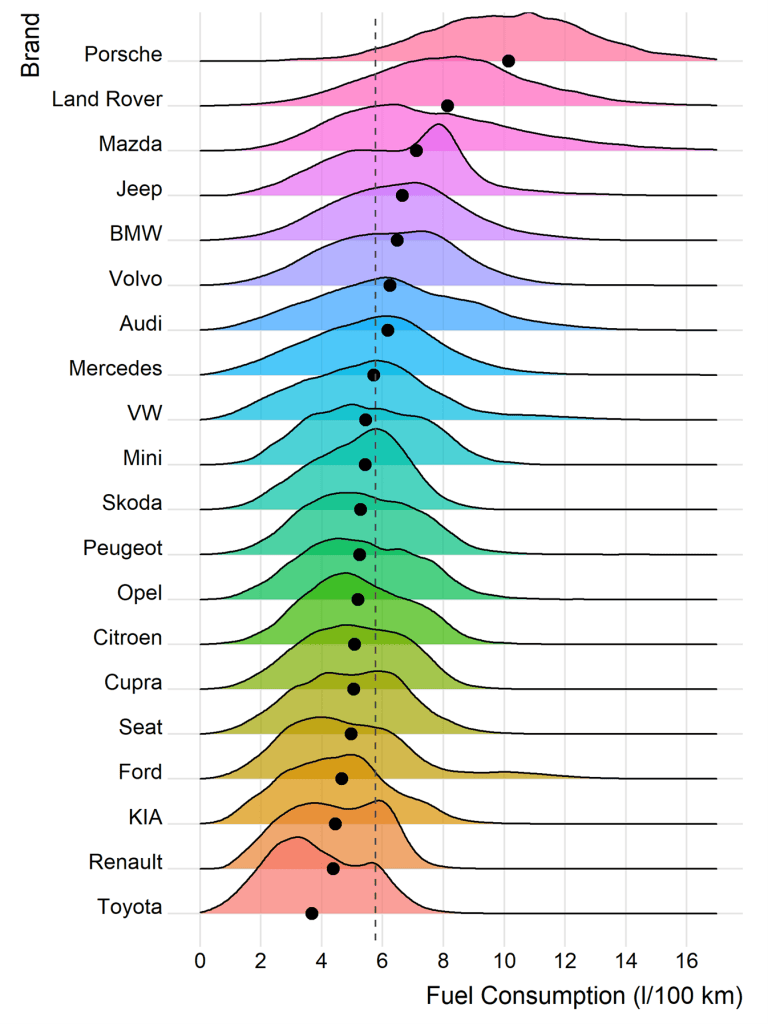
Overall, real-world fuel consumption by far exceeds type-approval values that were valid until the end of 2024 irrespective of manufacturer or model year. The following section will analyze the gap between type-approval and actual fuel consumption in more detail.
2.3 Fuel consumption Gap
The overall fuel consumption differences of the over 1.4 million PHEVs in Europe in the data are summarized in Figure 5. Fuel consumption is measured in liters per 100 kilometers (l/100 km). Official type-approval (WLTP) fuel consumption of gasoline PHEV has decreased from 1.7 to 1.25 l/100 km and from 1.4 to 1.0 l/100 km for diesel PHEV. However, actual real-world fuel consumption of PHEV in Europe, capturing on-road usage rather than laboratory test results, has slightly increased to around 6.0 – 6.2 l/100 km for both gasoline and diesel PHEVs. The overall sample contains 1’412’127 PHEV with 123’846 PHEV from reporting period 2021, 438’398 from 2022 and 849’883 from 2023.
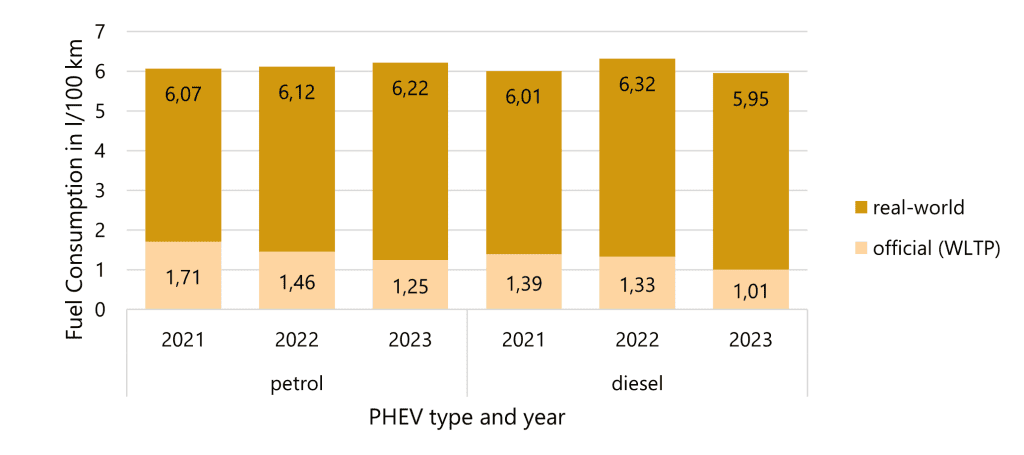
Figure 6 shows the official (WLTP based) and real-world fuel consumption values by manufacturer in comparison. As already indicated by the previous figures, all manufacturers clearly exceed the type-approval values in all three years.
2.4 Electric Driving and Charge Depleting Mode Shares
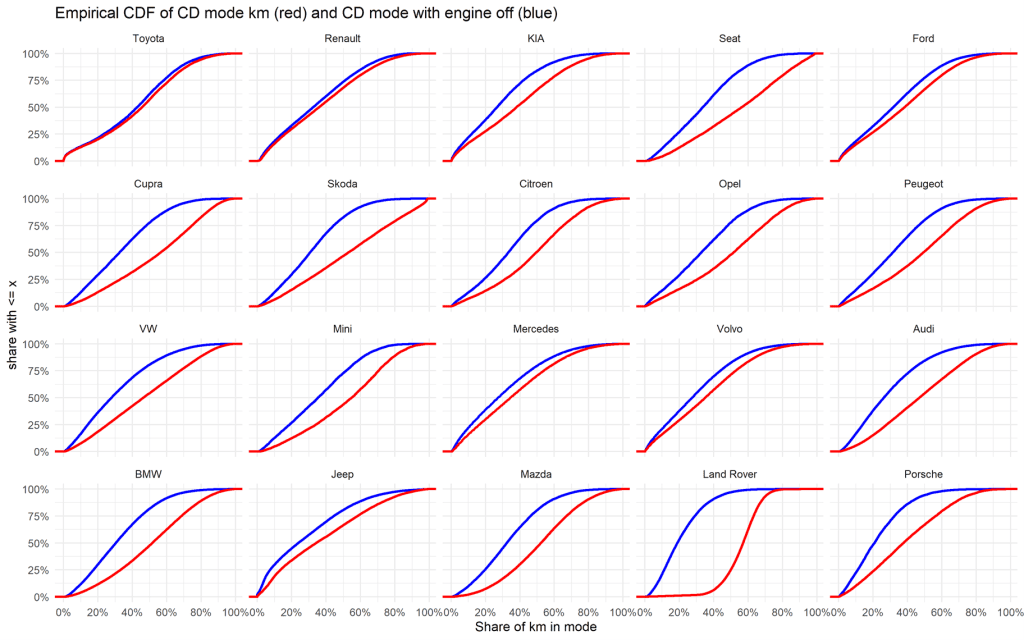
The main tail-pipe emissions reductions of PHEVs come from CD or all-electric driving. Accordingly, we analyze the “share of CD-mode km” and the “share of CD-mode km with engine off” in total lifetime distance driver per manufacturer.
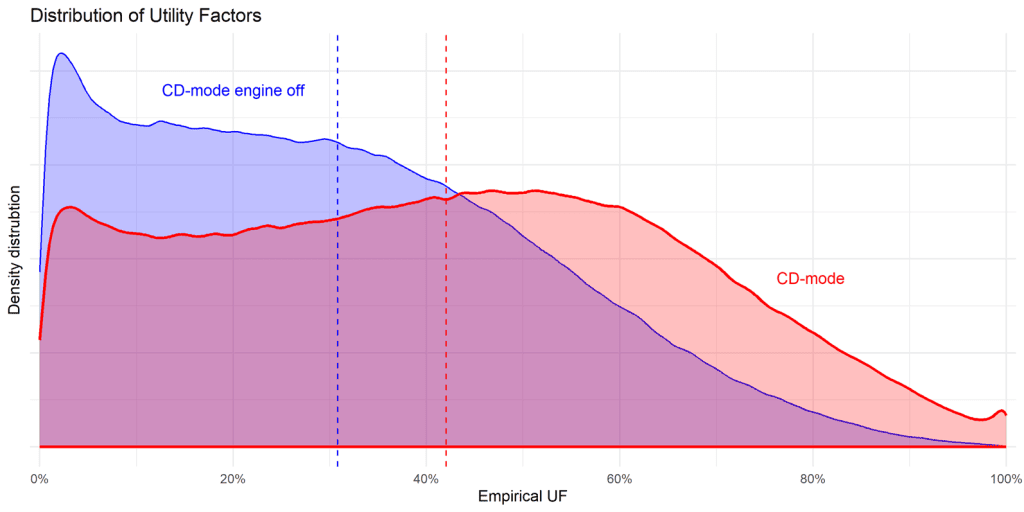
Figure 7 illustrates the empirical distribution of UFs across the fleet of PHEVs in the 2023 OBFCM data. The UF denotes the share of kilometers driven in CD mode, which is associated with electric operation. Two definitions of UF are shown: The red line and shaded area represent the UF based on all kilometers driven in CD mode (regardless of whether the combustion engine was active). The blue line and shaded area represent the UF based only on kilometers in CD mode with the combustion engine off, which more closely approximates the actual share of kilometers driven purely in electric mode.
The x-axis shows the empirical Utility Factor (UF, from 0percent to 100percent), while the y-axis reflects the estimated density, which can be understood as a smoothed version of the relative frequency of vehicles within each UF range. Instead of counting vehicles in fixed bins (as in a histogram), the density estimate uses a kernel-smoothing method to approximate the probability distribution of UF values across the sample. This makes the underlying distribution easier to interpret, since it highlights where observations are concentrated without depending on arbitrary bin widths. The area under each curve sums to one, so the height of the curve at a given UF value reflects how likely it is to observe a vehicle in that range.
The data reveal that a large portion of PHEVs exhibit low electric driving shares. Both distributions are skewed toward the lower end, especially the engine-off definition. For example, a significant number of vehicles have UFs below 20percent, particularly when only charge-depleting (CD) mode with engine off is considered. In contrast, the CD-mode-based UF suggests a somewhat more optimistic picture, with a broader distribution and more vehicles exceeding 40 to 60percent electric driving.
Vertical dashed lines mark the mean values of the two distributions: 31 percent for the share of kilometers in CD-mode with the combustion engine off, and 42 percent for the share of CD-mode kilometers in total. The figure therefore highlights not only the variation between different UF definitions but also how the choice of definition directly affects the interpretation of real-world electric driving shares and thus the assessment of emissions.
These findings highlight that not all CD mode kilometers are truly electric and that engine activation during nominal electric driving is common, particularly in more powerful or performance-oriented PHEVs. This underscores the importance of regulatory adjustments that not only track electric range but also ensure electric-first driving behavior and low-emission operation in practice, for example through real-use monitoring or functional usage criteria in incentive schemes.
Future research could look deeper into country specific effects, including, e.g., the importance of energy prices or company cars in electric driving shares of PHEVs (Mandev et al. 2022, Hamza & Laberteaux 2023, Hamza et al. 2024).
3. WLTP Regulation of PHEVs in Europe
3.1 EU CO2 Emissions Standards and PHEV Classification
The European Union has established stringent CO2 emission performance standards for new passenger cars and light commercial vehicles through Regulation (EU) 2019/631. This regulation sets fleet-wide average CO2 emission targets, with progressive reductions aimed at mitigating climate change impacts. Specifically, it mandates 93.6 g CO2/km for 2025-2029 and 49.5 g CO2/km for 2030-2034 under WLTP. From 2035 onwards, the EU fleet-wide CO2 emission target for both cars and vans is 0 g CO2/km, corresponding to a 100percent reduction.1Cf. Commission Implementing Decision (EU) 2023/1623
Under this framework, PHEVs have been classified as “low-emission vehicles” due to their ability to operate in electric mode, often achieving type-approval CO2 emissions below 50 gCO2/km. This classification has allowed manufacturers to count PHEVs favorably towards their fleet-average emissions, benefiting from mechanisms like super-credits (multiple counting) and ZLEV (Zero- and Low-Emission Vehicle) incentives. In the European system, super credits allowed each low-emission vehicle to be counted more than once when calculating fleet-average emissions, effectively lowering a manufacturer’s reported average. The ZLEV factor further rewards manufacturers with additional compliance flexibility if the share of low- and zero-emission vehicles in their sales exceeded certain thresholds, giving PHEVs a disproportionate contribution to meeting CO2 targets.
3.2 Utility Factors
To calculate type-approval CO2 emissions, WLTP applies a weighted average of emissions from the CD and CS modes. To this end, the driving emissions are first measured with the vehicle starting the test cycles with fully charged battery in CD mode until the battery is fully discharged and finally repeated with an empty battery. The weighting between CD and CS mode is based on the so-called Utility Factor (UF): a function that estimates the share of kilometers driven in CD mode, depending on the PHEV’s and CD mode range under WLTP conditions. The UF curve, defined in UN ECE Regulation No. 101 and adopted in the EU via Regulation (EU) 2017/1151, assigns higher electric driving and higher CD mode shares to PHEVs with longer electric ranges. For example, a PHEV with a 60 km electric range might receive a UF of about 75percent, meaning only 25 percent of its official CO2 emissions are based on combustion engine use. However, the WLTP approach assumes a fully charged battery before every driving day and does not account for driving behavior or charging infrastructure availability, both of which strongly influence real-world emissions.
In addition to CD and CS modes, many PHEVs offer a driver-selectable charge-increasing (CI) mode, also referred to as “charge mode” or “battery charge/hold mode”. In this mode, the internal combustion engine is used not only for propulsion but also to actively recharge the battery while driving. This results in higher real-world fuel consumption and CO2 emissions than either CD or CS mode. Although this mode is typically not used in the WLTP type-approval cycle, it is technically permissible under current regulation and has been identified as a way to further increase real-world fuel consumption although not regulated and contributing to discrepancies between type-approval and real-world performance.
Mathematically, the UF for CD-mode driving in the test cycle is given by
where x can be the WLTP all-electric range (AER) or the CD-mode range RCD in km and the numerical constants ci and dn for Europe are 𝑐1 = 26.25, 𝑐2 = − 38.94, 𝑐3 = −631.05, 𝑐4 = 5964.83, 𝑐5 = − 25095, 𝑐6 = 60380.2, 𝑐7 = −87517, 𝑐8 = 75513.8, 𝑐9 = − 35749, 𝑐10 = 7154.94 according to (EC 2017).
3.3 Recent Changes in the Regulation
Studies have revealed significant discrepancies between laboratory-tested and real-world emissions of PHEVs (Plötz et al. 2020, 2021, 2022, Raghavan & Tal 2022, Isenstadt et al. 2022). They indicate that, on average, privately owned PHEVs in Europe emit three times more CO2 in real-world conditions than laboratory tests suggest (Plötz et al. 2022). For company cars, the discrepancy is even greater, with real-world emissions up to four times higher (Plötz at al. 2022).
These discrepancies are primarily attributed to user behavior, such as infrequent charging and reliance on the internal combustion engine, which deviates from the assumptions made during type-approval testing. The WLTP testing procedures often overestimate the electric driving share, leading to underestimated CO2 emissions.
In response to these findings, the European Commission has initiated revisions to better align official emissions data with real-world performance in 2022. First, the utility factor calculations have been adjusted in 2023. The EU has revised the utility factor used to calculate PHEV emissions, reducing the assumed share of electric driving to reflect actual usage patterns.2More specifically, the scale parameter 𝑑𝑛 has been changed from 𝑑𝑛 = 800 km to 𝑑𝑛 = 2,200 km (valid since Jan 1st, 2025). This change aims to capture emissions more accurately, especially when the battery is depleted, providing a realistic assessment of PHEV performance as it leads to lower assumed share of km in charge depleting mode and thus higher type approval CO2 emissions.
Second, as part of the revision of the regulation in 2023, the European Union has proposed an even lower assumptions on the range dependent UF from 2027.3Specifically, the regulation has proposed a higher location parameter of 𝑑𝑛 = 4260 km for 1.1. 2027 However, the current regulation indicated that the 2027 value was up to revision in the light of new empirical evidence. With the large-scale real-world usage data collected via On Board Fuel Consumption Monitoring (OBFCM) and published by the European Environmental Agency (EEA), this assessment is now possible.
3.4 WLTP Utility Factors based on OBFCM data
Following Plötz et al. (2022), we fitted the best utility factor curve to the real-world data. The fitting is done via weighted non-linear least-squares on an aggregated level. We take the mean share of km in CD-mode4As the OBFCM data set does not contain the kilometers CD-mode, we take the all-electric range instead which is available in the data and slightly smaller than the individual CD-mode range. either in total or only with engine off per brand, model, fuel type, year and weight in the regression by the number of observations. We take simple averages instead of km-weighted averages to treat all vehicles equally. Hence, every vehicle equally contributes to the UF regression, regardless of its annual mileage. From a climate perspective, a mileage weighted average is also meaningful as the total CO2 emissions stem from the actual mileage weighted share of combustion engine driving.
Figure 8 illustrates the relationship between electric range and the utility factor UF based on Charge depleting (CD) mode usage for PHEVs. The figure shows both the real-world data and current as well as potential future projections of the UF curve. The upper dashed gray curve is the previous WLTP curve that was valid in Europe until the end of 2024, blue lines indicate the planned adaptations in the regulation. We only use the newest published data from 2023 which includes vehicles registered in 2023 and in previous years.
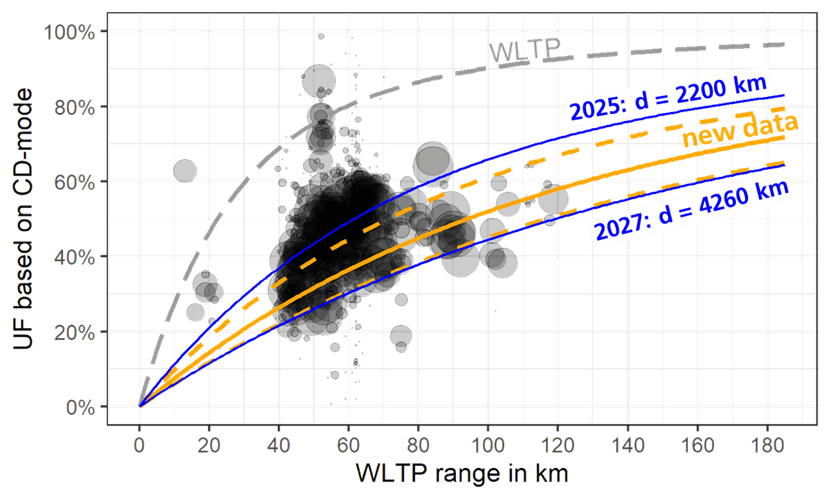
The actual model-average UF-mode shares in the data show substantial variation in UF across vehicle models with similar WLTP ranges, particularly in the 40 to 80 km range where most PHEVs cluster. Many models achieve 60 to 80 percent UF despite having WLTP ranges between 50 to 70 km, while others with comparable ranges show significantly lower UF around 20-40percent. Note the clear impact on assumed share of CD mode km in the regulation, e.g., for 60 km WLTP range: it used to be 80 percent until 2024, it is at about 50 percent in 2025 and 2026, and at about 30 percent from 2027 onwards.
The fit of the new data (orange lines) is not exact and comes with some uncertainty. Since the official data does not contain all the variables we would ideally need, we show two possible interpretations (the dashed orange lines). One is based on the share of kilometers driven in charge-depleting mode, and the other is based on the more restrictive case of kilometers in charge-depleting mode with the engine completely off. The solid orange line shows the average of these two, which makes it easier to compare with the other curves.5Technically, the Utility Factor (UF) can be modeled either as the relation between CD-mode share and CD-mode range, or as the relation between electric driving share and all-electric range. However, the OBFCM data does not contain the share of kilometers driven in charge-sustaining mode with engine off, only the share of kilometers in CD-mode with engine off. This means that the electric driving share is not directly available and has to be approximated. Similarly, the data contains the all-electric range but not the CD-mode range. Since the CD-mode range is only slightly larger than the all-electric range (as shown in Dornoff 2021), we approximate CD-mode range by all-electric range here. To reflect this uncertainty, we present both cases (CD-mode share: upper dashed line; and the CD-mode share with engine off: lower dashed line) and then use their average as a central reference. Although the regulation explicitly models the CD-mode share km, we include the second option to account for the ambiguity in the x-axis where the all-electric range has been used instead of the unavailable CD-mode range. The solid orange line represents the average between the two for ease of comparison.
We observe the following main findings from the analysis despite remaining uncertainty:
- The current 2025 UF curve is too optimistic on real-world UF of PHEV as all orange lines are below the 2025 UF curve.
- Current PHEV appears to located between the 2025 and 2027 UF curves.
- The UF curve seems not to fully capture the relation between CD-mode share and range. For this reason, PHEV with all-electric range over 60 km seem to systematically deviate from the function (short-ranged PHEV over solid orange line and long-ranged PHEV below).
The following Table 2 summarizes the regression results in terms of the obtained scaling factors dn. The numbers are stable when using data from other years than 2023. The errors indicate the uncertainty from finite data by stating the mean ± two standard errors.
| Which curve? | d Value in km |
| WLTP | 800 |
| Year 2025 | 2200 |
| Year 2027 | 4260 |
| OBFCM Lower | 2550 ± 70 |
| OBFCM Mean | 3360 ± 80 |
| OBFCM Upper | 4170 ± 90 |
These findings are robust across multiple regression models and confirm that the current 2025 UF curve (with a scaling parameter d = 2200 km) is overly optimistic. The observed vehicle behavior consistently falls below this benchmark, indicating that current regulations still overestimate the electric driving share of PHEVs, and consequently underestimate their real-world emissions. Interestingly, the models used here lie between the 2025 and 2027 regulatory UF curves, with the best-fit mean regression suggesting a scaling factor of dn = 3360 km, indicating that a UF curve between these two regulatory versions might better reflect actual use. However, the observed deviations between short- and long-range PHEVs (with the former often above and the latter below the average fit) suggest that the current UF function may not adequately capture behavioral heterogeneity, and more flexible modeling approaches could be considered.
3.5 Discussion of results
Our analysis of the OBFCM data for 2023 comes with some limitations. One methodological consideration concerns how electric driving behavior is aggregated: our results are based on vehicle-level averaging, where each vehicle contributes equally to UF regression, regardless of its annual mileage. This differs from kilometer-weighted averaging, which would place greater weight on high-mileage vehicles, often cars with lower electric usage, thus very likely resulting in even lower average UF values. The choice of averaging method has significant policy implications, as vehicle-level averaging may overestimate the emission benefits of PHEVs in the real world.
A second key point concerns the specification of the UF curve itself. In the current WLTP framework, the UF is defined as the share of kilometers driven in CD mode, modeled as a function of the CD-mode range. However, since OBFCM data lacks both an explicit measure of CD-mode range and an electric driving share across all modes, approximations were necessary. First, we used the all-electric range (AER) as a proxy for CD-mode range, based on their close correspondence in WLTP test definitions. Second, the UF on the y-axis was approximated in two ways: one using the CD-mode share (i.e., kilometers driven in CD-mode), and one more restrictive version that counts only CD-mode kilometers with the combustion engine off. These two versions, shown as upper and lower dashed orange lines respectively, span the likely true values and reflect the uncertainty introduced by limited data granularity.
In terms of the best estimation of the UF, an European Commission staff working document has proposed a third UF measure based on energy usage in different drive modes (cf. Appendix C in EC 2024). Overall, the energy based UF derivation is more conservative than the two estimates shown here in the sense that the UF are smaller. The mean values for the full European PHEV fleet for 2021 as analyzed EC (2024) are shown in the following table. Please note that the values in the table are based on 2021 registrations only but they clearly indicate systematic differences between the UF definitions and arithmetic or km-based averages.
| UF based on… | Arithmetic average | Km-weighted average | Comment |
| CD mode only | 42.0 % | 37.9 % | Upper value used in the present study |
| CD mode engine off | 31.3 % | 26.3 % | Lower value used in the present study |
| Energy | 27.6 % | 22.2 % | Not used in the present study |
It is worth noting that other jurisdictions, such as China, are also reconsidering their UF curves and PHEV treatment. For example, the Chinese regulatory framework has proposed significantly more conservative UF assumption with a different UF curve which does not approach 100 percent for large ranges but only 87.6 percent6The formula for the UF curve is the same but the coefficients c1 to c10 are 14.4, -50.38, 102.13, -128.95, 107.32, -61.05, 24.17, -6.66, 1.26, -0.15 and dn = 1000 km which does not approach 100percent for growing range, but approaches 87.6 percent for R = 1000 km. (NTCAS 2025). This international context reinforces the urgency for the EU to align its regulatory methodology with observed usage patterns and technological developments. A revised UF curve combined with robust real-world monitoring would be essential to ensure that any future role for PHEVs, such as potential sales post-2035 under strict conditions, does not undermine the EU’s long-term climate objectives.
Finally, the quality and coverage of OBFCM data are a strength of this analysis, given that it includes a large share of the PHEV fleet newly registered in recent years. However, several caveats remain: the dataset may not capture company car usage adequately if OBFCM uploads are delayed or incomplete, and manufacturer-specific calibration issues could bias individual UF estimates (minor technical or methodological differences in OBFCM data collection among manufacturers could systematically skew the UF estimates when comparing PHEVs across brands or models). Further improvement in data completeness and harmonization, particularly concerning CD-mode identification and combustion engine activation, would allow for more precise analyses in future policy evaluations.
4. Options for PHEV in Future European Fleet Regulation
While the EU plans to phase out the sale of new internal combustion engine vehicles by 2035, some stakeholders have recently proposed allowing PHEVs beyond this deadline. From an emissions perspective, this is problematic for several reasons:
- Numerous studies show that real-world PHEV emissions often exceed official figures due to limited electric driving and frequent engine use.
- The additional PHEV remain in the vehicle fleet for many years and make climate neutral transport by 2050 for EU27 and by 2045 for Germany much less likely.
- The existing 2035 combustion engine sales ban in Europe is already too late when compared to GHG emission budgets for transport that are compatible with the Paris agreement (Plötz et al. 2023).
Nonetheless, regulatory frameworks such as California’s Zero Emission Vehicle (ZEV) mandate permit PHEVs to count toward compliance under strict conditions, with a cap of up to 10 percent of sales. California (and the other US states that follow the ZEV mandates) is a relevant example here, as it already has implemented rules under which PHEV can be sold with strict minimal requirements. In Europe, parts of the automotive industry have advocated for similar flexibility after 2035. This raises an important scientific and policy question: if PHEVs were to remain part of the post-2035 new vehicle mix, under what technical and regulatory conditions could they deliver meaningful emission reductions and align with climate targets? The present section addresses this question by developing and discussing elements of a potential regulatory framework for PHEV sales after 2035 in Europe.
We propose the following key elements of a potential PHEV regulatory framework after 2035 in Europe based on existing frameworks in California and China. It consists of five elements that are summarized in Figure 9911 and explained below. Our suggestions consist of specific elements of a regulation. Our focus here is on the elements of the regulation whereas the induvial numbers are clearly subject to political debate and the values proposed here are intended as guidelines.
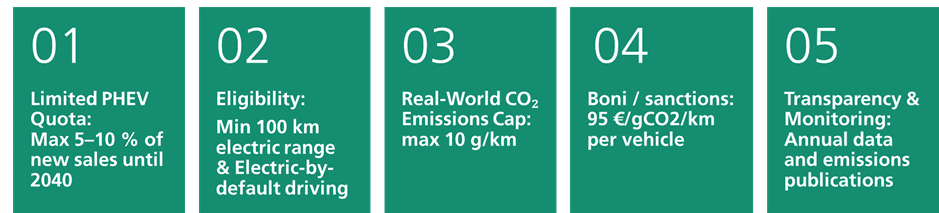
Limited PHEV Sales Quota per Manufacturer
To ensure that PHEVs do not undermine Europe’s goal of a zero decarbonized vehicle fleet by mid-century, we propose limiting their share of new vehicle sales to a maximum in the order of 5 to 10 percent per manufacturer. This restriction acknowledges that while PHEVs may serve a transitional role for specific user groups but their broad adoption would risk locking in continued fossil fuel use and delaying the shift to battery electric vehicles. A quota of 5 to 10 percent provides flexibility for manufacturers to serve these niches while aligning with regulatory precedents such as California’s ZEV regulation, which allows limited PHEV contributions under increasingly stringent eligibility rules with a maximal market share of 10 percent for PHEV. Furthermore, to ensure European GHG neutrality of vehicle fleet by 2050, the exception for PHEV sales after 2035 should be limited to very few years, maximally until the end of the 2030ies.
Strong eligibility conditions for PHEVs
Only PHEVs that meet stringent technical and usage-based conditions should qualify under this framework. A minimum electric range of at least 100 km (WLTP) and fully electric driving even under difficult conditions ensures that the vehicle can cover most daily trips without using the combustion engine. This value is well above the current market average and reflects both technological progress and evidence on real-world electric driving shares. Eligible vehicles must also be designed for electric-first operation by default, minimizing combustion engine activation in typical use. Finally, real-world usage data must be automatically collected and verifiable through On-Board Fuel and Energy Consumption Monitoring (OBFCM) systems, a technology already mandated for new vehicles in the EU and critical for policy enforcement and accountability.
Real-World CO2 Emissions Cap
To ensure that PHEVs deliver actual emissions reductions, we propose a cap on their real-world CO2 emissions. The specific value is subject to negotiation but a value of, for example, 10 g CO2/km equivalent to roughly 0.4 liters of fuel per 100 km would be an ambitious but achievable threshold for PHEVs with frequent charging and high electric use, and it reflects current performance benchmarks for the best-performing models in empirical studies. Importantly, the 10 g CO2/km cap would apply not to individual vehicles but as a fleet-wide average for all newly registered PHEVs by each manufacturer. This approach mirrors fleet compliance structures already used in EU vehicle CO2 regulation and allows flexibility while maintaining overall environmental integrity. By grounding compliance in real-world data collected via OBFCM, the regulation would close the gap between test-cycle and actual emissions performance, a known major issue in past PHEV policy frameworks. We understand this idea could be a paradigm shift in fleet wide emission regulation, but it is not without precedent: NOx emissions are already regulated and measured in real-world driving conditions (real-world driving emissions – RDE) and the extension to PHEVs would be straightforward with the large-scale availability of OBFCM data.
Sanctions and Bonus Mechanisms
To reinforce compliance and promote best practices, we propose a system of sanctions and rewards tied to real-world fleet emissions performance just as in the already existing system in the current EU CO2 fleet regulations. Manufacturers whose PHEV fleets exceed the 10 g CO2/km cap would face financial penalties or adverse adjustments to their fleet compliance calculations under the CO2 regulation, creating a clear disincentive to sell poorly performing models. Conversely, manufacturers achieving fleet averages significantly below the threshold, for example, below 5 g CO2/km, could receive bonus credits or flexibility in other regulatory obligations similar to the existing super credits and ZLEV factors, thereby encouraging innovation and customer engagement strategies that prioritize electric usage. The actual level of sanctions could follow the current EU sanctions of 95 € per gram and vehicle sold in Europe, possibly with a phase-in such that, for example, the sanctions are lower for the first 5 g and take the full value beyond that to acknowledge the large impact of user instead of manufacturer behavior in PHEV emissions.
Transparency and Monitoring
Transparency and ongoing policy evaluation are essential to ensure the framework remains effective over time. We recommend the continuation of annual publication of aggregated real-world CO2 emissions data for PHEV fleets by brand, based on OBFCM reporting, to allow independent analysis and stakeholder scrutiny. In addition, a formal policy revision after two years should evaluate market performance, technological developments, and behavioral trends. However, the additional PHEV sales after 2035 can only be possible for very few years as they are additional combustion engine vehicles that remain in the vehicle fleet and decrease the chances of carbon neutral road transport by 2050 in the EU and 2045 in Germany.
Discussion
A consistent phase-out of combustion engine vehicles after 2035 would be the clearest and most effective path toward zero-emission transport. Allowing exceptions for PHEVs could only be justified under strict conditions, for example if they demonstrated verifiably high electric driving shares and operated almost entirely on electricity in real-world use. However, ensuring and monitoring such performance requires additional regulatory mechanisms and data verification. The additional administrative effort and compliance costs might therefore outweigh the limited environmental benefits, making a full and unambiguous combustion engine phase-out the more efficient and transparent policy choice. However, here we presented several regulatory options of how PHEVs could be sold after 2035 for a few years if deemed necessary.
The present section proposed a post-2035 PHEV regulation that offers several important advantages by shifting from lab-based assumptions to a real-world, performance-based framework. By relying on OBFCM data, the regulation directly links regulatory compliance to the actual share of electric driving, creating strong incentives for manufacturers to design vehicles in ways that maximize electric usage and minimize emissions. This approach aligns regulatory targets with real-world climate outcomes rather than idealized test conditions. It also enables empirical monitoring of compliance and facilitates more adaptive policymaking through evidence-based updates. The flexibility of a performance-based system allows for technological innovation while ensuring that only vehicles achieving genuinely low emissions remain on the market.
At the same time, implementing such a system poses several challenges that must be carefully addressed. OBFCM data quality and completeness can vary by manufacturer and model, and there is a risk of data manipulation if oversight mechanisms are weak. However, regular evaluation, comparison and feedback on the data collection will improve quality and the overall importance of real-world savings outweighs the risk of manipulation. Privacy concerns may also arise if vehicle-level data collection is perceived as intrusive or insufficiently anonymized. Moreover, the administrative burden of aggregating, verifying, and interpreting fleet-wide averages, especially across different model lines and vehicle uses, can be significant. The regulatory system will also need to manage time lags, as OBFCM data is typically available only with about a one-year delay, which limits the immediacy of compliance feedback and may reduce the responsiveness of the regulation. To be effective, the system will require robust governance, technical standardization, and clear accountability.
Annex: Data set description
Further analyses
References
Bradley T H and Frank A A (2009) Design, demonstrations and sustainability impact assessments for plug-in hybrid electric vehicles Renew. Sustain. Energy Rev. 13 115–28
Chakraborty D, Hardman S and Tal G (2020) Why do some consumers not charge their plug-in hybrid vehicles? Evidence from Californian plug-in hybrid owners Environ. Res. Lett. 15 084031
Dornoff, J. (2021). Plug-in hybrid vehicle CO2 emissions: How they are affected by ambient conditions and driver mode selection. The International Council on Clean Transportation: Berlin/Heidelberg, Germany, 57.
EAFO (European Alternative Fuels Observatory) (2025): Vehicle registrations in EU27. European Alternative Fuels Observatory. https://alternative-fuels-observatory.ec.europa.eu/transport-mode/road/european-union-eu27, last accessed: June, 2nd, 2025.
EC (European Commission) (2023): Commission Regulation (EU) 2023/443 of 8 February 2023 amending Regulation (EU) 2017/1151 as regards the emission type approval procedures for light passenger and commercial vehicles (Text with EEA relevance) https://eur-lex.europa.eu/eli/reg/2023/443/oj
EC (European Commission) (2024): COMMISSION STAFF WORKING DOCUMENT Accompanying the document Report from the Commission Commission report under Article 12(3) of Regulation (EU) 2019/631 on the evolution of the real-world CO2 emissions gap for passenger cars and light commercial vehicles and containing the anonymised and aggregated real-world datasets referred to in Article 12 of Commission Implementing Regulation (EU) 2021/392. https://eur-lex.europa.eu/legal-content/EN/TXT/?uri=celex:52024SC0059
EEA (European Environmental Agency) (2023): Monitoring of CO2 emissions from passenger cars Regulation (EU) 2019/631. https://www.eea.europa.eu/en/datahub/datahubitem-view/fa8b1229-3db6-495d-b18e-9c9b3267c02b?activeAccordion=1094576
EEA (European Environmental Agency) (2025): Real world emissions. https://climate-energy.eea.europa.eu/topics/transport/real-world-emissions/intro
Hamza, K., & Laberteaux, K. P. (2023). Utility Factor Curves for Plug-in Hybrid Electric Vehicles: Beyond the Standard Assumptions. World Electric Vehicle Journal, 14(11), 301.
Hamza, K., Laberteaux, K., & Chu, K. C. (2024). An Approach for Estimating the Contributions of Various Real-World Usage Conditions towards the Attained Utility Factor of Plug-In Hybrid Electric Vehicles. World Electric Vehicle Journal, 15(10), 458.
IEA (2025), Global EV Outlook 2025, IEA, Paris https://www.iea.org/reports/global-ev-outlook-2025, Licence: CC BY 4.0
IEA (International Energy Agency) (2025): Global EV Outlook 2025. https://www.iea.org/reports/global-ev-outlook-2025
Isenstadt, A., Yang, Z., Searle, S., & German, J. (2022). Real world usage of plug-in hybrid vehicles in the United States. Real world usage of plug-in hybrid vehicles in the United States.
Mandev, A., Plötz, P., Sprei, F., & Tal, G. (2022). Empirical charging behavior of plug-in hybrid electric vehicles. Applied Energy, 321, 119293.
NTCAS (National Technical Committee of Auto Standardization) (2025): 关于征求《乘用车车载能源消耗量监测技术要求》推荐性国家标准和GB/T 19753—2021《轻型混合动力电动汽车能量消耗量试验方法》(第1号修改单)意见的函 (Letter on Soliciting Opinions on the Recommended National Standards of “Technical Requirements for Monitoring the On-board Energy Consumption of Passenger Vehicles” and GB/T 19753-2021 “Test Methods for Energy Consumption of Light-duty Hybrid Electric Vehicles” (Revision No. 1)), cf. http://zxd.catarc.org.cn/zxd/portal/detail/zqyj/622
Plötz P, Funke S A, Jochem P and Wietschel M 2017 CO2mitigation potential of plug-in hybrid electric vehicles larger than expected Sci. Rep. 7 16493
Plötz, P., Link, S., Ringelschwendner, H., Keller, M., Moll, C., Bieker, G., … & Mock, P. (2022). Real-World Usage of Plug-in Hybrid Vehicles in Europe: A 2022 Update on Fuel Consumption, Electric Driving, and CO₂ Emissions.
Plötz, P., Moll, C., Biecker, G., Mock, P., & Li, Y. (2020). Real-world usage of plug-in hybrid electric vehicles: Fuel consumption, electric driving, and CO₂ emissions.
Plötz, P. and Jöhrens, J. (2021): Realistic Test Cycle Utility Factors for Plug-in Hybrid Electric Vehicles in Europe. Karlsruhe: Fraunhofer Institute for Systems and Innovation Research ISI.
Plötz, P., Moll, C., Bieker, G., & Mock, P. (2021). From lab-to-road: Real-world fuel consumption and CO2 emissions of plug-in hybrid electric vehicles. Environmental Research Letters, 16(5), 054078.
Plötz, P., Wachsmuth, J., Sprei, F., Gnann, T., Speth, D., Neuner, F., & Link, S. (2023). Greenhouse gas emission budgets and policies for zero-Carbon road transport in Europe. Climate Policy, 23(3), 343-354.
Raghavan, S. S., & Tal, G. (2022). Plug-in hybrid electric vehicle observed utility factor: Why the observed electrification performance differ from expectations. International Journal of Sustainable Transportation, 16(2), 105-136.
Smart J, Bradley T and Salisbury S 2014 Actual versus estimated utility factor of a large set of privately owned Chevrolet VoltsSAE Int. J. Altern. Powertrains 3 30–35.
Tansini, A., Pavlovic, J., & Fontaras, G. (2022). Quantifying the real-world CO2 emissions and energy consumption of modern plug-in hybrid vehicles. Journal of Cleaner Production, 362, 132191.
UNECE (United Nations Economic Commission for Europe) 2014 Regulation No. 101. ‘Uniform provisions concerning the approval of passenger cars powered by an internal combustion engine only, or powered by a hybrid electric power train with regard to the measurement of the emission of carbon dioxide and fuel consumption and/or the measurement of electric energy consumption and electric range, and of categories M1 and N1 vehicles powered by an electric power train only with regard to the measurement of electric energy consumption and electric range’ (available at: www.unece.org/trans/main/wp29/wp29regs/r101r2e.pdf)
VDA (Verband der Automobilindustrie) (2025): 10-Point Plan for Climate-Neutral Mobility. Position paper. https://www.vda.de/de/presse/Pressemeldungen/2025/250606_PM_2030-2035_CO2-Flottenregulierung