
PyPSA (Python for Power System Analysis) is an open source modelling framework for optimizing investment and operation in energy systems at high temporal and spatial resolution [1]. PyPSA has been open source since 2015 and is used by hundreds of modellers in research institutes, companies and NGOs around the world. PyPSA-DE is an adaption of the European open model dataset PyPSA-Eur that focuses on Germany and the interaction with its neighbors [2]. PyPSA-DE models supply, demand, storage and transmission networks to cover energy and non-energy demand in the electricity, heating, transport, agriculture and industry sectors. In 5 year steps from 2020 to 2050, PyPSA-DE builds a linear optimization problem to minimize total system costs to plan the energy system infrastructure in Germany and its neighbors, using up to 40 regions in Germany and hourly resolution across full weather years.
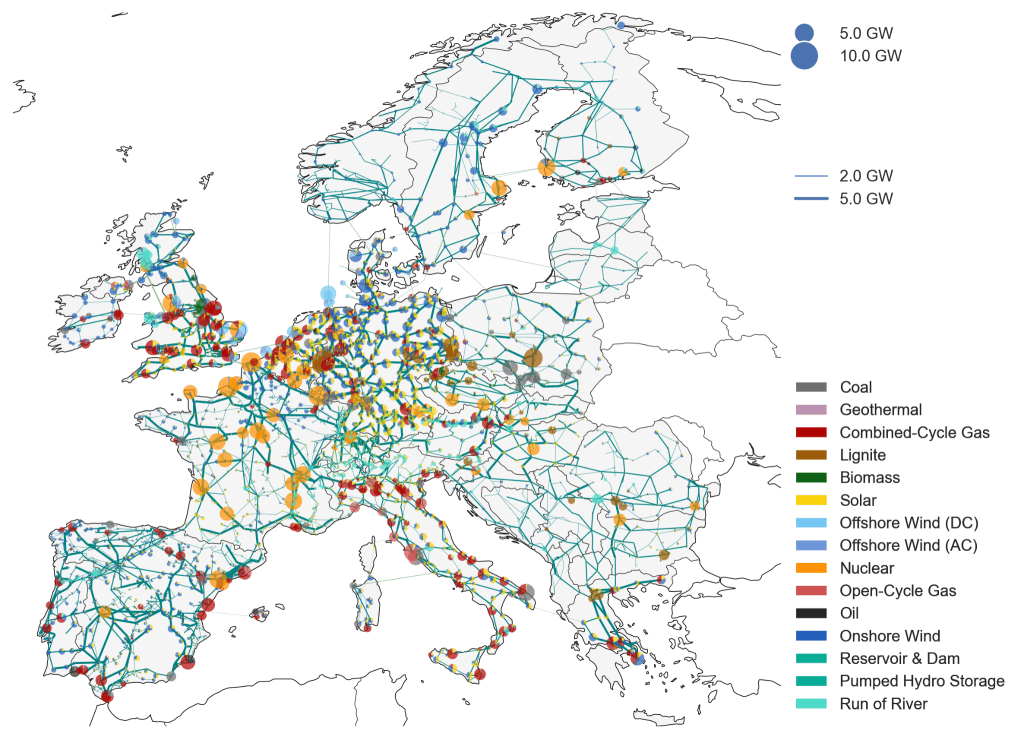
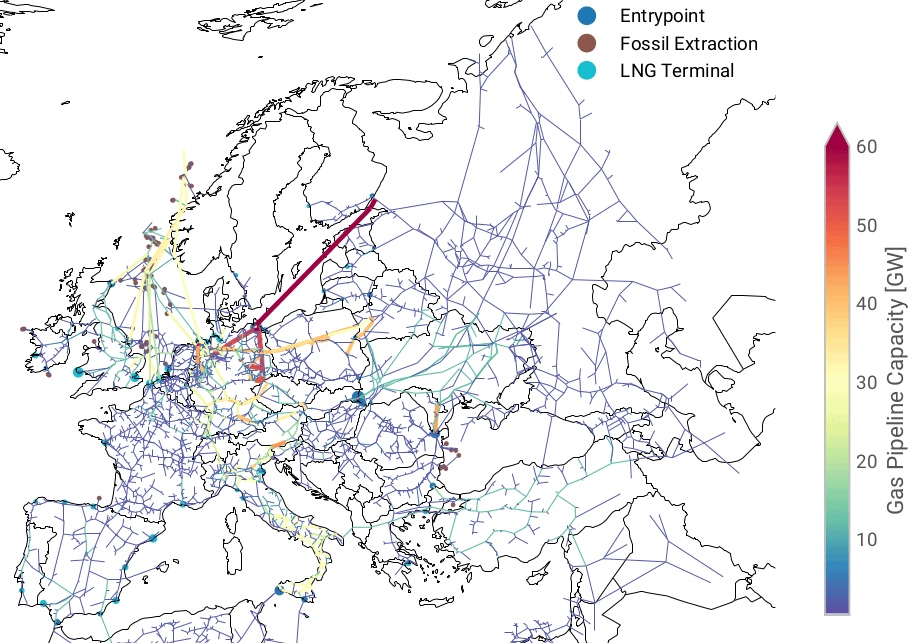
The spatial resolution of PyPSA-DE can be flexibly adapted according to the level of detail required. The power sector, including all power transmission lines in Europe, is shown at full resolution (below left). The transmission network data includes around 3000 substations, 6600 HVAC lines and 70 HVDC links. Additional transport networks for methane (below right), hydrogen and carbon dioxide, as well as biomass land transport, are included at the same resolution. For computational tractability, the networks are aggregated to a few hundred regions representing major supply and demand centers across Europe, and the connections between them.
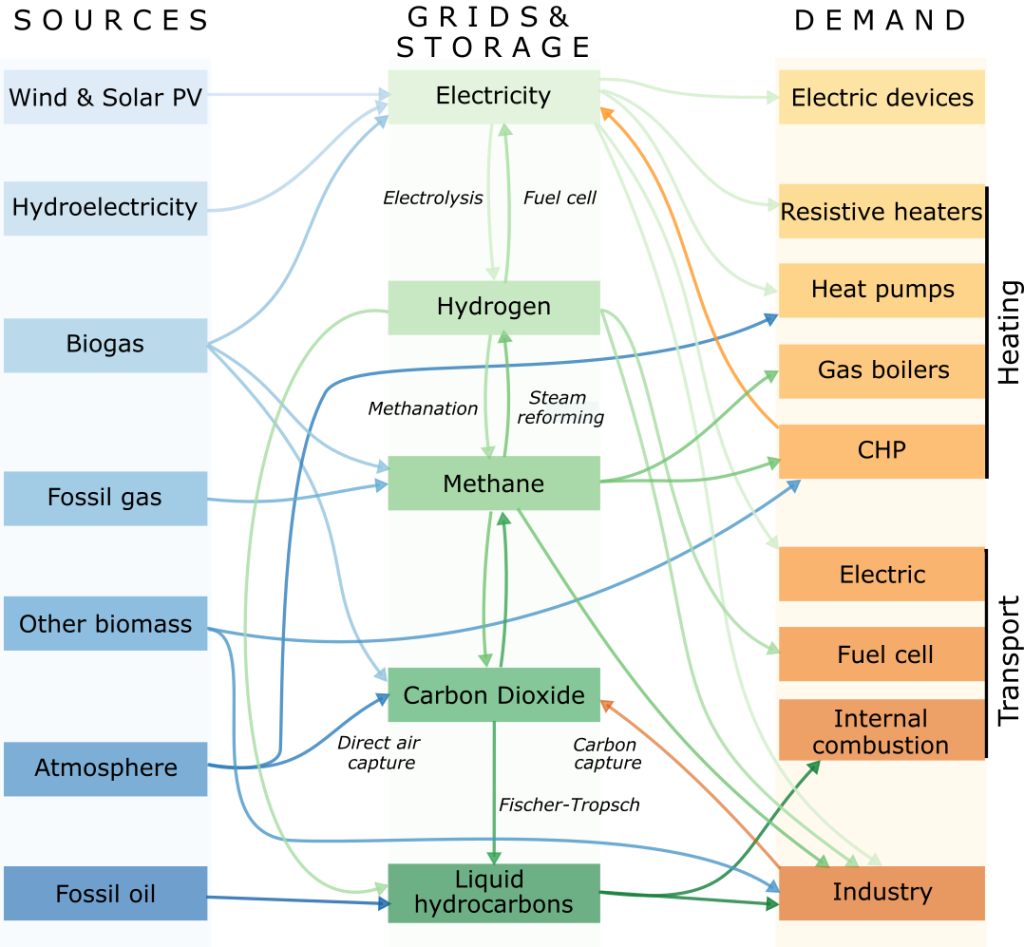
Conversions between different energy carriers and materials are specified through a graph with energy carriers and materials at the nodes (such as power, methane, hydrogen, ammonia and primary energy carriers) and conversion processes at the edges (such as power stations, electrolysis or steel plants). A selection of different carriers and conversion processes from the model is displayed below.
PyPSA-DE provides detailed sub-sectoral resolution, covering all relevant carbon dioxide emitting sectors (other greenhouse gas emissions are not considered). Heating in buildings is split into rural and urban regions, with the possibility to use district heating in urban areas, as well as into residential, services and industrial sectors. The transport sector consists of land transport (split into various transport modes), shipping and aviation. In industry all the major sub-sectors, including feedstocks, are separated so that different fuel- and process-switching can be modeled. The sub-sectors include steel (primary and secondary), chemicals (split into HVC, ammonia, methanol and chlorine), non-metallic mineral products and non-ferrous metals. The different energy carriers and materials include electricity (divided into transmission and distribution level), building heat (divided into individual and district heating as well as rural and urban areas), methane, oil-based products, coal, hydrogen, ammonia, methanol, carbon dioxide and biomass (split into solids and biogas). For hydrogen, electricity, methane and carbon dioxide, the transmission networks are modeled. The model encompasses process emissions and the need for feedstocks in the chemical industry and dense hydrocarbon fuels for aviation. The consideration of these processes requires management of the carbon cycle, which includes carbon capture from industrial processes, biomass with carbon capture and storage (BECCS), direct air capture, carbon sequestration and use of captured carbon dioxide, for example, to produce synthetic methane or liquid hydrocarbons.
The model offers flexibility in analyzing energy systems over different time horizons, accommodating short-term operational planning as well as long-term strategic decision-making. Time series aggregation for e.g. typical days, based on the tsam package are included as an option in the model. With its adaptable temporal resolution, users can simulate energy systems with varying levels of detail, from hourly dispatch schedules to annual assessments. PyPSA-DE will optimize myopically over the investment horizons to maximize the level of temporal and spatial detail.
By accounting for trade dynamics, including imports and exports of energy commodities, PyPSA-DE provides insights into how energy policies and infrastructure investments may influence regional and international trade patterns. The neighboring countries are incorporated in the Ariadne model as single nodes. PyPSA-DE does not incorporate a macroeconomic model.
Energy Supply
PyPSA-DE includes energy and non-energy supply, incorporating primary sources like fossil fuels, renewables, and nuclear power. The electricity sector integrates hourly demand with generation from renewables (hydropower, PV, wind, biomass), conventional sources (coal, lignite, nuclear, gas) and combined heat and power plants (coal, lignite, gas, biomass), alongside storage options (batteries, pumped-hydroelectricity), and supports the production of other energy carriers (e.g., hydrogen, synthetic gases) for storage and re-electrification. Installable potentials for wind and solar are calculated on a regional basis based on land cover and excluded areas (such as nature reserves), while biomass potentials are based on the JRC-ENSPRESO database. Electricity transmission between regions (based on the ENTSO-E map) are modeled with the linearised power flow approximation (“DC load flow”) as well as a simplified capacity restriction to the distribution level. Additionally, PyPSA integrates secondary energy sources such as hydrogen and synthetic fuels. Hydrogen can be produced by steam methane reforming or autothermal reforming from carbonaceous fuels, or by electrolysis. Hydrogen can be stored in steel tanks or caverns, and can be transported either in new pipelines or repurposed natural gas pipelines. Hydrogen can then be further combined with carbon dioxide to produce synthetic methane, methanol or liquid hydrocarbons. Through sector coupling, it captures the interconnections between electricity, heating, transport, and industrial sectors, enabling holistic energy system optimization. PyPSA-Aridane includes existing and planned electricity, methane and hydrogen transmission networks, as well as highly spatially resolved demand, supply and storage potential (e.g. for hydrogen or carbon dioxide). This allows the optimisation of electricity, hydrogen, methane and carbon dioxide transmission networks, including the option to retrofit existing methane pipelines to hydrogen pipelines.
Energy demand
Transport
Transport and mobility comprises light and heavy road, rail, shipping and aviation transport.
Annual energy demands for this sector are derived from the JRC-IDEES database [3]. The demand in each sector and its distribution across energy carriers (carbonaceous fuels, hydrogen, ammonia and electricity) is adapted from the ALADIN model outputs. The total annual demand for land transport is distributed to an hourly time-series using a characteristic weekly profile from the German Federal Highway Research Institute (BASt). Different time zones in the respective European countries and summer time are taken into account when generating the hourly profiles. The charging demand of electric cars is spread over three hours in relation to the transport demand. As the average distances traveled in Europe are short and direct charging after use is assumed, one third of the transport demand for a specific hour is assumed as the charging profile of the electric cars directly in that hour, one third one hour later and one third two hours later. A share of vehicles can then adapt exactly when they charge with the constraint that the battery is 75% full by 7am. Vehicle-to-grid mode can also be enabled for the vehicles to feed into the electricity system. For international shipping, the demand of each country is allocated based on port trade volumes, as reported in the World Bank Catalog [4]. Shipping demand is split between heavy fuel oil, methanol, ammonia and hydrogen on an exogenous basis.
Industry
The industry’s energy demand for a specific investment period is determined in two steps. First, today’s energy demand and process emissions are extracted from the JRC-IDEES database [3] for each country and calculated on a per unit material demand basis for all the major sectors. Missing data in the JRC-IDEES database and future specific energy demands for each industry sub-sector are supplemented by other data sources.
Secondly, the energy demand and emissions for a given investment period are then calculated based on transformation pathways in the respective sub-sectors using per-unit material ratios at a national level. The material production over the investment periods is taken from the FORECAST model.
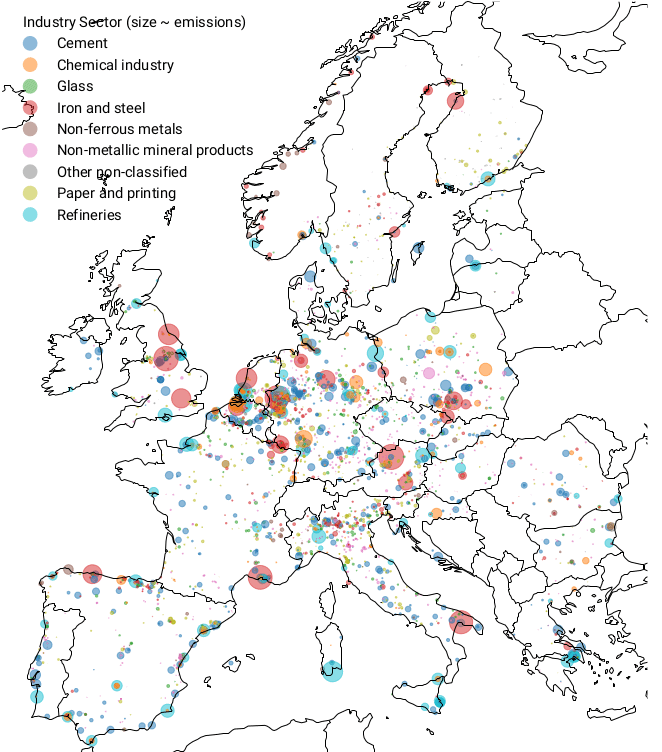
Sub-sectors include iron and steel (primary via blast furnace or direct reduction with hydrogen plus electric arc furnace (EAF), secondary via EAF), non-ferrous metals, chemicals (high value chemicals, ammonia, methanol, chlorine), non-metallic minerals, pulp and paper, food and tobacco, and light machinery. Geographically, the industrial demand is distributed within a country based on the Hotmaps Industrial Database [5]. This database provides georeferenced locations of energy-intensive industrial sectors within the EU28, including sub-sectors such as cement, basic chemicals, glass, iron and steel, nonferrous metals, non-metallic minerals, paper, and refinery. In the default scenarios we assume that industrial production for different investment periods remains in the same location and that there is no relocation of industry to other regions. This restriction can be relaxed so that materials at various points of the value chain can be relocated or imported.
Buildings
The buildings sector is split between residential, services and industry, and includes decentral heat supply in individual housing as well as centralized district heating for urban areas. Heating demand can be met through gas, oil or biomass boilers, air- and ground-sourced heat pumps, resistive heaters, solar thermal collectors as well as waste heat from synthetic fuel production in district heating networks. Thermal energy can be stored in large water pits for long duration storage in district heating networks (where space in cities allows) and small water tanks for individual heating.
The total heat demand for Germany is taken from statista and then evenly distributed across Germany. For Ariadne, the heat demand is planned to additionally be distributed according to NUTS -3 data on the distribution of heating technologies in German households including their lifetime. Building retrofitting rates are taken from Ariadne central scenarios.
Flexibility (storage, DSM, grids)
PyPSA includes several storage options to represent different forms of energy storage within the energy system. Electric energy can be stored in batteries (home, utility-scale, electric vehicles), existing pumped-hydro storage (PHS), hydrogen storage and other synthetically produced energy carriers (like methane and methanol). To store electricity, hydrogen may be produced by water electrolysis, stored in above-ground steel tanks or underground salt caverns, and re-electrified in a utility-scale fuel cell. Synthetic methane can be re-electrified through an open cycle gas turbine (OCGT) or a combined heat and power (CHP) plant. Thermal energy storage (TES) is available in large water pits associated with district heating networks for seasonal storage and small water tanks for decentral short-term storage.
Demand side management is represented in different sectors. Battery-electric vehicles can perform load shifting during their charging process, as long as the state of charge reaches a certain level by morning. The flexible operation of electrolysis and other synthesis processes leads to a price dependent electricity consumption.
The topology of the European electricity transmission network is represented at substation level based on maps released in the interactive ENTSO-E map. [6] The alternating current network is modeled using the linear power flow approximation (“DC load flow”) with piecewise linear losses, while direct current connections are modeled with linear losses. The existing European gas transmission network is represented based on the SciGRID Gas IGGIELGN dataset [7]. Gas pipelines can be endogenously expanded or repurposed for hydrogen transport. Hydrogen can be transported via pipelines. These can be retrofitted natural gas pipelines or completely new pipelines. Gas flows are represented by a lossy transport model. Biogas can be upgraded and then transported via the methane network.
Liquid hydrocarbons are assumed to be transported freely among the model region since there is existing infrastructure available, transport costs for liquids are low and no bottlenecks are expected.
Policy instruments and measures
PyPSA can include various policy instruments and measures. Most importantly, it limits emissions by imposing a cap on annual CO2 emissions. Renewable energy expansion targets can be implemented as a minimum capacity constraint for these technologies. Future infrastructure projects such as the “Wasserstoff Kernnetz” as well as hydrogen production goals are incorporated into the model. Technology bans on e.g., nuclear or coal are also considered. Energy efficiency standards, such as regulations to improve the energy efficiency of buildings, appliances and industrial processes, are included.
Methods and model framework
PyPSA-DE minimizes total system costs, including annualized investment and operational expenditures. Final energy demand, energy services demand (for building heating) and industrial production (for chemicals and steel) is assumed to be exogenous and inelastic. The model can consider multiple investment periods. The modeling of these multiple investment periods can be implemented in one single optimization problem (perfect foresight) or with myopic foresight in subsequent optimization problems.
With myopic foresight, every investment period is individually optimized under a given CO2 target. The optimized infrastructure is then used for the following investment period. The myopic foresight approach is used in PyPSA-DE. Contrary to assuming perfect foresight, the myopic approach provides a potentially more expensive solution. However, it captures better the shortsighted decisions by policymakers and investors, as well as allowing higher resolution modeling in the intervening years. Technologies installed in previous time steps remain in the system and contribute to the total system cost until they reach the end of their lifetime. A myopic approach is used in 5-year time steps from 2020 to 2050 [8]. Shadow prices of all constraints can give indicative prices for all major carriers and commodities. The commercial solver Gurobi is used to solve the optimization problem.
Overview of exogenous assumptions and endogenous outputs
| Exogenous assumptions: | ||
| Variable | Source | Comment |
| GHG targets | Bundesregierung | 65% in 2030, 88%, in 2040, 100% in 2045 |
| renewables capacity targets | Bundesregierung | |
| electrolysis capacity targets | Bundesregierung | |
| Population | Ariadne common scenarios | |
| Macroeconomics / GDP (in reference run) | Ariadne common scenarios | |
| Industry demand (electricity, hydrogen) | FORECAST for material demand | inelastic |
| Mobility (share of electrification) | ALADIN | inelastic |
| Agriculture demand | Ariadne common scenarios | |
| Shipping (MeOH) and aviation (E-Fuels) | Ariadne common scenarios | |
| Final Energy / Energy Service Demand (in reference run) | Adapted from JRC-IDEES based on Ariadne common scenarios | inelastic |
| Secondary Energy Trade (e.g. Hydrogen, E-Fuels) | Ariadne-specific assumptions on imports of hydrogen and e-fuels. | |
| Technology costs (partly) | Mostly from Danish Energy Agency, some depend on the scenario narrative | |
| Biomass potential | JRC-ENSPRESO | (See Remind) |
| Renewable installable potentials | Land cover from CORINE, EEZ, Natura2000 | |
| Hydrogen underground potential | Caglayan et al. | https://doi.org/10.1016/j.ijhydene.2019.12.161 |
| Existing methane transmission grid + methane entry points | SciGRID Gas | IGGIELGN dataset |
| Spatial distribution of industry demand within a country | Hotmaps Industrial Database | https://doi.org/10.5281/zenodo.4687147 |
| Carbon dioxide sequestration potential | European CO2 storage database of the European Commission | https://setis.ec.europa.eu/european-co2-storage-dat abase_en |
| Existing conventional powerplant capacities | Powerplantmatching (based on various sources) | |
| Spatial distribution of existing heating capacities | Demand Regio | Planned, not yet implemented |
| Existing renewable capacities | IRENASTAT | |
| Endogenous outputs: | ||
| Variable | Model representation | Comment |
| Energy system costs | CAPEX and OPEX of all deployed technologies to meet the exogenous demand | |
| CO2 Price | shadow price of the CO2 constraint | We observe two CO2 prices, one for the CO2 constraint on Germany and one for an overallCO2 constraint on Europe |
| Energy prices of different technologies | Shadow prices of the balance equations of the specific technology | |
| CO2 Emissions | Amount of CO2 emissions by emitting technology | |
| Hydrogen production, storage and demand | Regional and hourly | Demand in transport and industry is exogenous |
| Carbon Management | CDR and CCU technologies, sequestration and transport | CDR: BECCS, DACCS CCU: production of synthetic carbon-based liquid and gaseous energy sources (e-fuels) |
| Investments | ||
| Capacity extensions | ||
| Electricity, methane, hydrogen and CO2 flows between Germany and neighbouring countries | Connecting electricity nodes between Germany and its neighbours | |
| High-spatial resolution | Up to 50 nodes for Germany | High spatial model resolution enables the derivation of supply, demand, technology capacity expansion and emissions per Bundesland |
| Energy grid (gas, hydrogen, electricity, CO2) expansion | Links as interconnectors between the different buses for the energy carriers electricity, methane, hydrogen and CO2 | Future transmission grid infrastructure expansion can be modelled at high spatial resolution |
Links and references
- [1]: Brown, T., Hörsch, J. and Schlachtberger, D., 2018. PyPSA: Python for Power System Analysis. Journal of Open Research Software, 6(1), p.4.DOI: https://doi.org/10.5334/jors.188
- [2] Fabian Neumann, Elisabeth Zeyen, Marta Victoria, and Tom Brown. The potential role of a hydrogen network in Europe. 2023, https://www.sciencedirect.com/science/article/pii/S2542435123002660
- [3]: European Commission. Joint Research Centre., JRC-IDEES: Integrated Database of the European Energy Sector : Methodological Note., Publications Office, LU, 2017. URL https://op.europa.eu/en/publication-detail/-/publication/989282db-ad65-11e7-837e-01aa75ed71a1/language-en
- [4]: World Bank. World Bank Data Catalog – Global – International Ports. Online, 2022. URL https://datacatalog.worldbank.org/
- [5]: Hotmaps. Hotmaps. URL https://www.hotmaps-project.eu/hotmaps-project/
- [6]: ENTSO-E, ENTSO-E transmission system map. URL https://www.entsoe.eu/data/map/
- [7]: A. Pluta, W. Medjroubi, J. C. Dierich, J. Dasenbrock, H.-P. Tetens, J. E. Sandoval, O. Lunsdorf, SciGRID gas – Data Model of the European Gas Transport Network, in: 2022 Open Source Modelling and Simulation of Energy Systems (OSMSES), IEEE, Aachen, Germany, 2022, pp. 1–7. doi:10.1109/OSMSES54027.2022.9769122.
- [8]: Marta Victoria, Elisabeth Zeyen, and Tom Brown. Speed of technological transformations required in Europe to achieve different climate goals. Joule, 6(5):1066–1086, 2022. ISSN 2542-4785. doi: 10.1016/j.joule.2022.04. 016. URL https://doi.org/10.1016/j.joule.2022.04.016. Accessed: 2023/10/05.
- PyPSA documentation: https://pypsa.readthedocs.io/en/latest/
Link to source codes (for open-source models)
- PyPSA-DE Github repository: https://github.com/PyPSA/pypsa-de
- PyPSA-Eur Github repository: https://github.com/PyPSA/pypsa-eur
- PyPSA Github repository: https://github.com/PyPSA/pypsa
- PyPSA technology data: https://github.com/PyPSA/technology-data